Home /
Expert Answers /
Earth Sciences /
1-map-a-is-an-example-of-which-one-of-the-following-types-of-thematic-map-1-pa194
(Solved): 1) Map A is an example of which one of the following types of thematic map? 1 ...
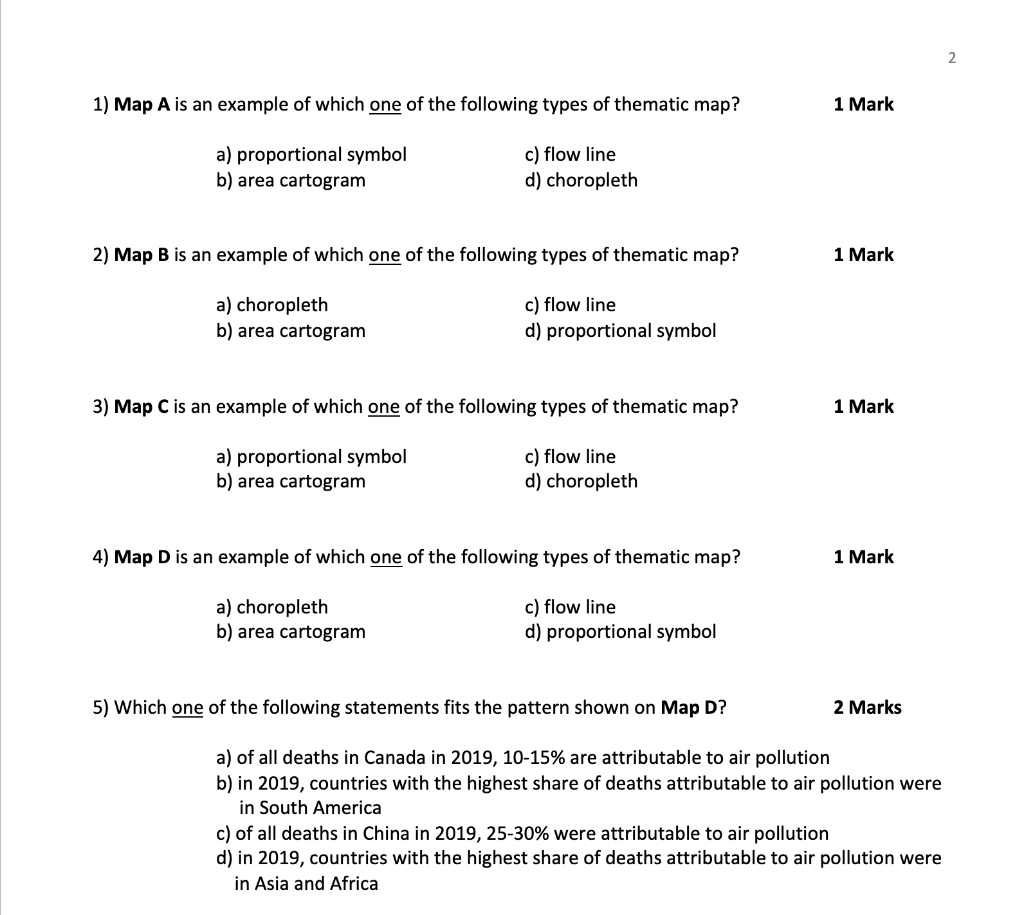
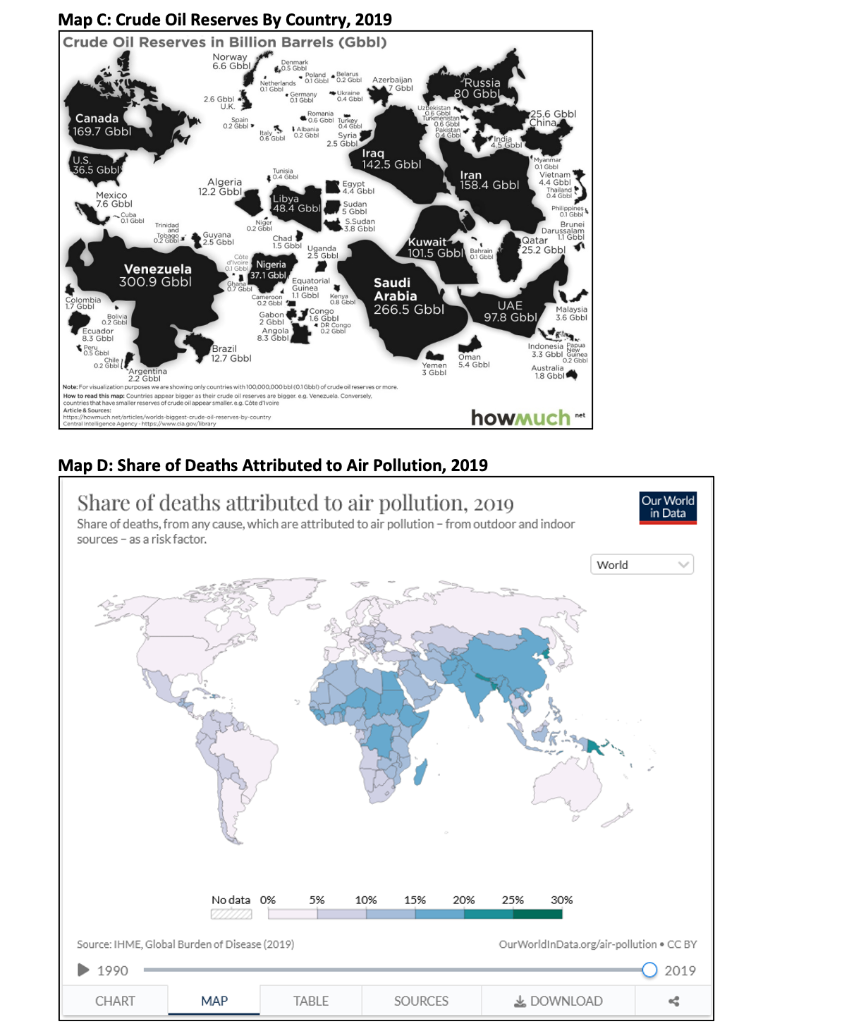
1) Map A is an example of which one of the following types of thematic map? 1 Mark a) proportional symbol c) flow line b) area cartogram d) choropleth 2) Map B is an example of which one of the following types of thematic map? 1 Mark a) choropleth c) flow line b) area cartogram d) proportional symbol 3) Map C is an example of which one of the following types of thematic map? 1 Mark a) proportional symbol c) flow line b) area cartogram d) choropleth 4) Map D is an example of which one of the following types of thematic map? 1 Mark a) choropleth c) flow line b) area cartogram d) proportional symbol 5) Which one of the following statements fits the pattern shown on Map D? 2 Marks a) of all deaths in Canada in 2019, 10-15\% are attributable to air pollution b) in 2019, countries with the highest share of deaths attributable to air pollution were in South America c) of all deaths in China in 2019, 25-30\% were attributable to air pollution d) in 2019, countries with the highest share of deaths attributable to air pollution were in Asia and Africa
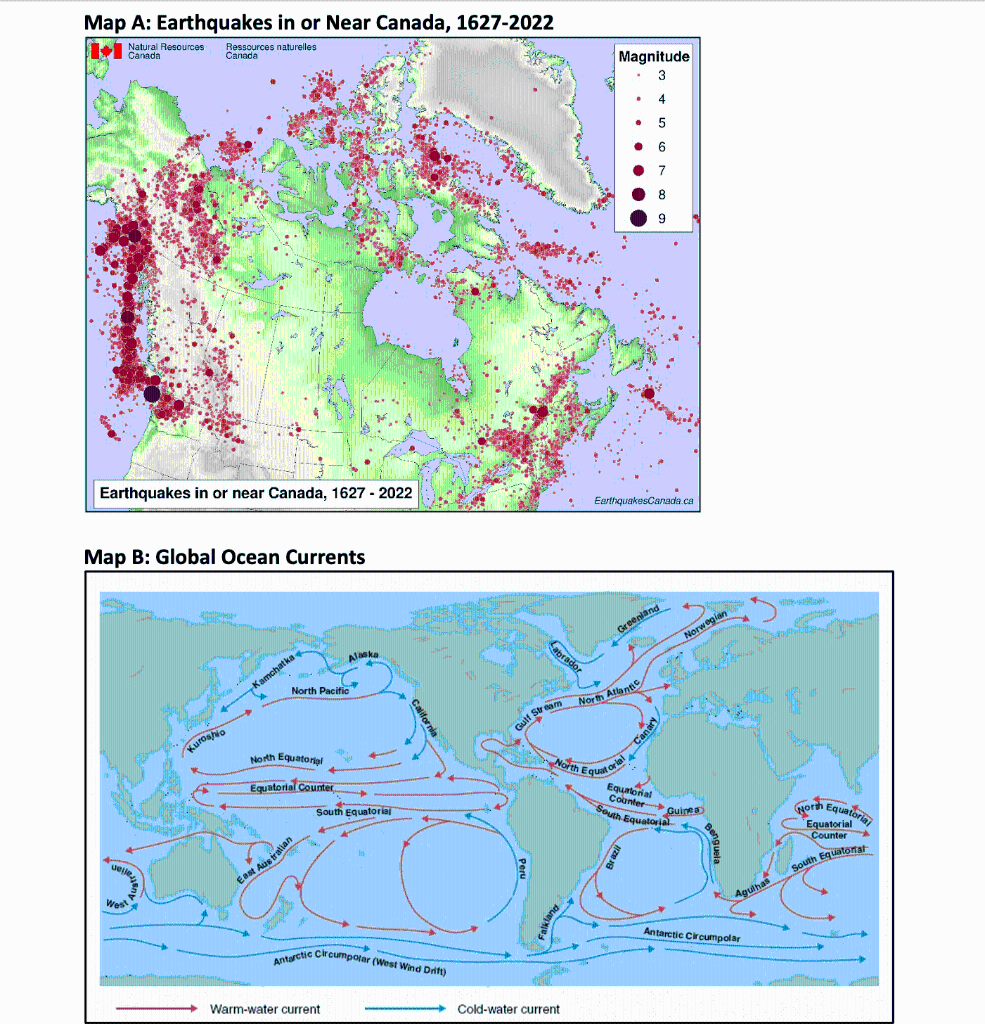
Afan A. Eanthnumbere in nr Mlonr Cannda 1c27-on??
Map D: Share of Deaths Attributed to Air Pollution, 2019 Share of deaths attributed to air pollution, 2019 Share of deaths, from any cause, which are attributed to air pollution - from outdoor and indoor
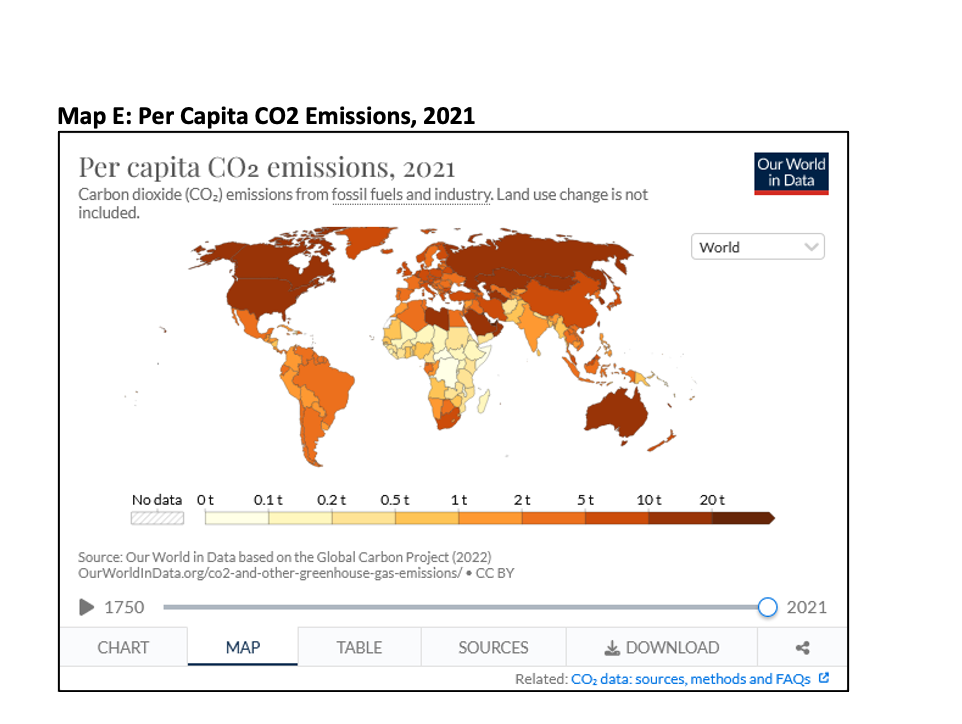
Per capita emissions, Carbon dioxide emissions from fossil fuels and industry. Land use change is not included Source: Our World in Data based on the Global Carbon Project (2022) OurWorldInData.org/co2-and-other-greenhouse-gas-emissions/• CC BY
Expert Answer
Answer 1 : Option a Proportional SymbolAnswer 2