(Solved): 1a. Using the data on the 'data' tab, construct a scatterplot of the two variables in the space belo ...
1a. Using the data on the 'data' tab, construct a scatterplot of the two variables in the space below.
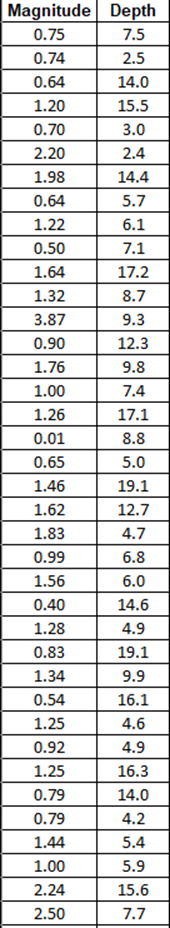
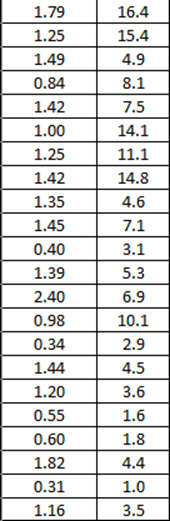
In the scatterplot, include at least the axes names and a title of the graph.
1b. Describe the scatterplot above. Identify the two variables and any correlation that you observe in the scatterplot above. Explain your answer.
provide justification and conclusion
2a. Calculate the value of the linear correlation coefficient r and the critical value of r using ? = 0.05.
Show your calculations for r below. Include an explanation on how you found the critical value.
3a. Find the regression equation. Let the predictor (x) variable be the magnitude. Identify the slope and the y-intercept within your regression equation.
Show your calculations below. Describe how you constructed the regression equation.
3c. What would be the best predicted depth of an earthquake with a magnitude of 2.6? Include the correct units.
Show your calculations below. Explain how you determined your answer.