Home /
Expert Answers /
Earth Sciences /
learning-objective-see-how-we-sort-out-what-climate-was-like-in-the-past-even-if-solar-output-d-pa179
(Solved): Learning objective: See how we sort out what climate was like in the past. Even if solar output d ...
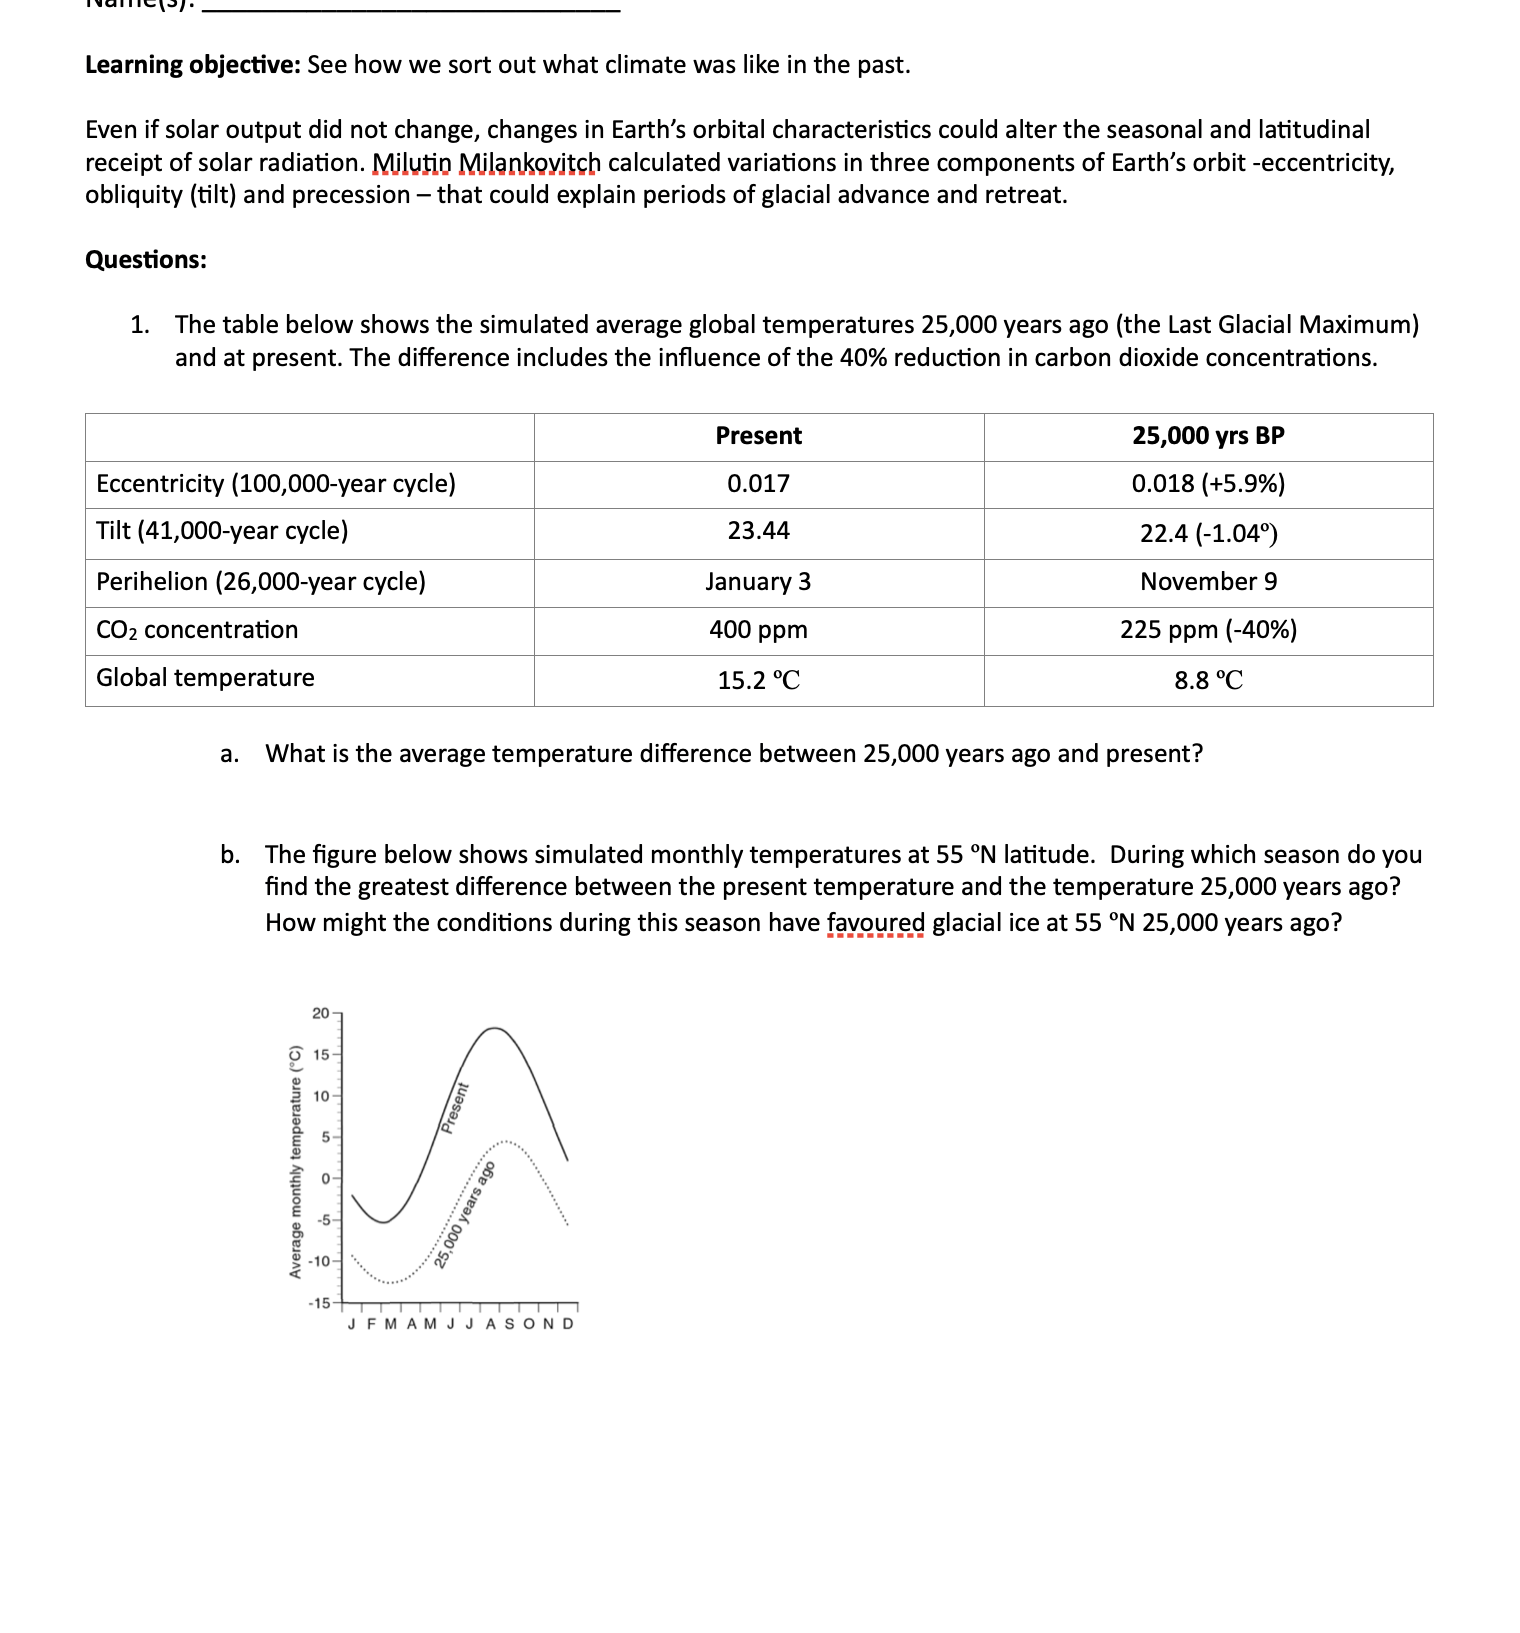
Learning objective: See how we sort out what climate was like in the past. Even if solar output did not change, changes in Earth's orbital characteristics could alter the seasonal and latitudinal receipt of solar radiation. Milutin Milankovitch calculated variations in three components of Earth's orbit -eccentricity, obliquity (tilt) and precession - that could explain periods of glacial advance and retreat. Questions: 1. The table below shows the simulated average global temperatures 25,000 years ago (the Last Glacial Maximum) and at present. The difference includes the influence of the reduction in carbon dioxide concentrations. a. What is the average temperature difference between 25,000 years ago and present? b. The figure below shows simulated monthly temperatures at latitude. During which season do you find the greatest difference between the present temperature and the temperature 25,000 years ago? How might the conditions during this season have favoured glacial ice at years ago?
1. Over the summer my graduate students and I collected tree cores from trees located in the Mt Rose Wilderness near Hunter Creek. These trees are part of a study my Masters student, Victoria Harris, is working on to produce an updated reconstruction of streamflow in the Truckee River. a. Knowing what you now know about tree rings why do you think trees from Hunter Creek might be a good proxy for streamflow in the Truckee? 2. Let's check. You have been provided with a spreadsheet (Lab 4 Table 2) that contains the full tree-ring chronology for Hunter Creek (Ring Width Index) as well as climate data pulled from PRISM for the Reno area going back to 1895. For convenience I have compiled these data into, average summer (June-August) and average winter (prior Oct-Mar) temperatures (Tav) and total summer (June-August) and total winter (prior Oct-Mar) precipitation (ppt). a. Make a scatterplot of the Ring Width Index (on the X-axis) and the climate variable(s) that you think the trees at Hunter Creek would be the most sensitive to. Add a trendline and display the value? What is it? Is it positive or negative? b. Looking at the scatterplot for winter precipitation do the ring widths do a better job at capturing extreme lows or extreme highs of precipitation? Why do you think this might be? 3. You have also been provided with a time-series of Truckee River Full Natural Flows a. Make a scatterplot of the Ring Width Index (on the X-axis) and Truckee River flow on the -axis. What is the ? Is this better or worse than what you found in ? b. Now click on the tab for RWI below. This is the full ring width time series for Hunter Creek. What do you notice about this graph? When did the lowest RWI occur? c. Based on this graph and the climate relationships you found above. What information could you pass along to the Truckee River Water Authority that could help them in planning for the future?