(Solved): Note that lanes 3 and 4 are swapped 1. Label the lanes on this Gelt as 1-10. In the figure descripti ...
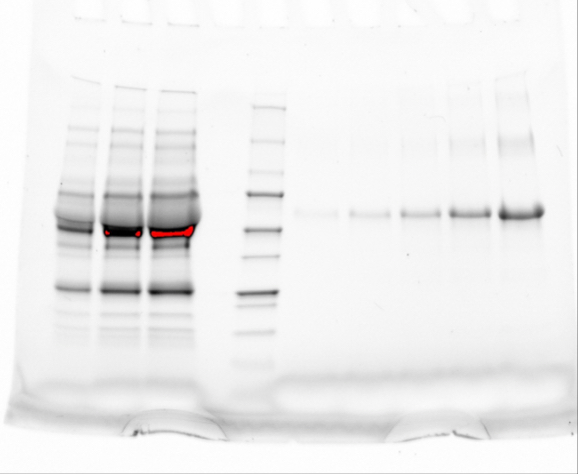
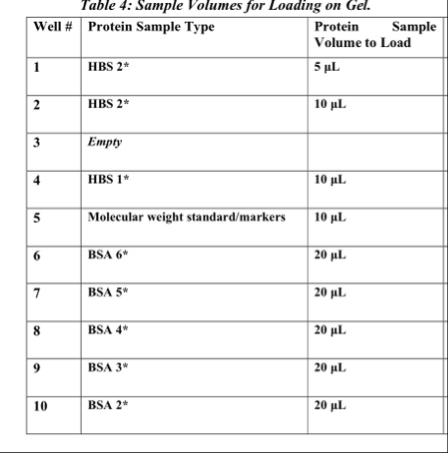
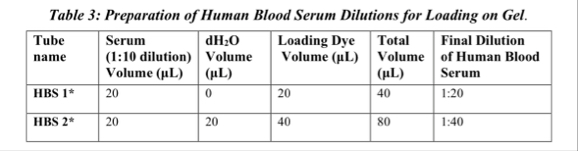
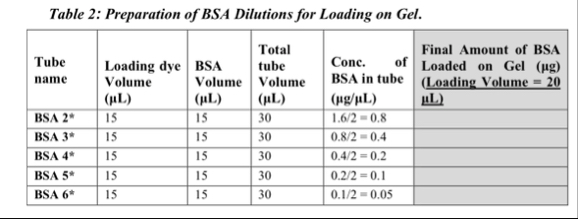
Note that lanes 3 and 4 are swapped 1. Label the lanes on this Gelt as 1-10. In the figure description, describe the contents of each lane. 2. Analyzing the gel using Image J software to quantitate the concentration of human albumin: a) show the table (from Excel) of your standard curve of theBSA and the human albumin band; b) show the plot for your standard curve.Make sure you have the axes labelled. Show the trend line, the R? value, and the line equation.Page 8 of 11Electrophoresis of Serum Proteins Using SDS-PAGE3. Analyzing the gel using Image J software to determine the molecular mass of the human album: a) show your table of (from Excel) your standard curve for the molecular mass markers and your estimation of the size (in kDa) for the human albumin band. 4. Using your estimated molecular mass, calculate the molarity of the albumin in the human serum sample. 5. You calculated the concentrations for each of the three human serum samples you prepared. Are the values the same for each of these samples? If not, provide a scientific explanation. Supporting information should be cited appropriately.6. Imagine you had another lane on your gel that contained the protein Titin.Assuming that the pixel count for the Titin was 10,000, calculate the moles of Titin in this lane, which contains 1 uL of undiluted sample.