(Solved): The results of particle size analysis and, where appropriate, Atterberg limit tests on samples of ...
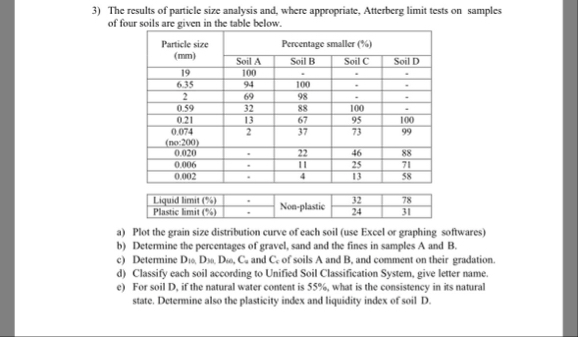
The results of particle size analysis and, where appropriate, Atterberg limit tests on samples of four soils are given in the table below. \table[[Particle size (mm),Percentage smaller (%)],[Soil A,Soil B,Soil C,Soil D],[19,100,-,-,-],[6.35,94,100,*,-],[2,69,98,-,-],[0.59,32,88,100,-],[0.21,13,67,95,100],[0.074 (no-200),2,37,73,99],[0.020,*,22,46,88],[0.006,*,11,25,71],[0.002,*,4,13,58]] \table[[Liquid limit (%),
**,Non-plastic,32,78],[Plastic limit (%),
**,24,31]] a) Plot the grain size distribution curve of each soil (use Excel or graphing softwares) b) Determine the percentages of gravel, sand and the fines in samples
Aand
B. c) Determine
D_(10),D_(20),D_(20),C_(8)and C s of soils A and B , and comment on their gradation. d) Classify each soil according to Unified Soil Classification System, give letter name. e) For soil D , if the natural water content is
55%, what is the consistency in its natural state. Determine also the plasticity index and liquidity index of soil D .