Home /
Expert Answers /
Calculus /
the-shaded-region-between-the-graphs-of-y-2-x-2-20-and-y-3-x-15-is-displayed-below-i-pa392
(Solved): The shaded region between the graphs of \( y=-2 x^{2}+20 \) and \( y=3 x-15 \) is displayed below i ...
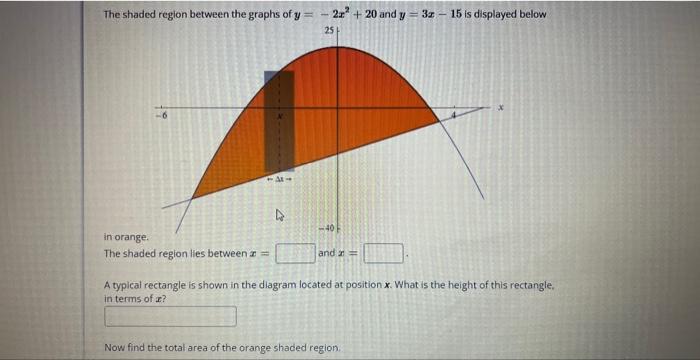
The shaded region between the graphs of \( y=-2 x^{2}+20 \) and \( y=3 x-15 \) is displayed below in orar. one The shaded region lies between \( x=\quad \) and \( x= \) A typical rectangle is shown in the diagram located at position \( x \). What is the height of this rectangle. in terms of \( x \) ? Now find the total area of the orange shaded region.