Home /
Expert Answers /
Calculus /
use-the-level-curves-in-the-figures-to-predict-the-location-of-the-critical-points-off-and-whether-pa876
(Solved): Use the level curves in the figures to predict the location of the critical points off and whether ...
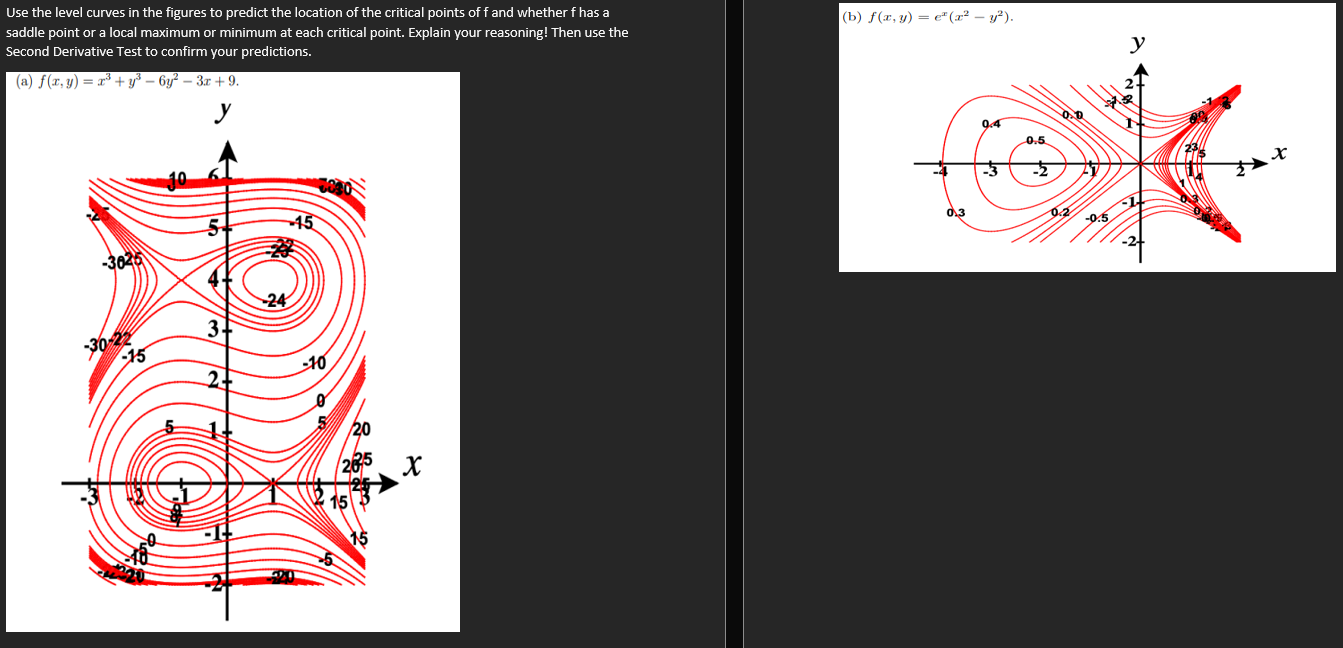
Use the level curves in the figures to predict the location of the critical points off and whether f has a saddle point or a local maximum or minimum at each critical point. Explain your reasoning! Then use the Second Derivative Test to confirm your predictions. (a) f(x, y) = x³ + y³ ? 6y² ? 3x + 9. y 15 -3625 -30-22 -15 3 2+ -10 20 285 15 15 X (b) f(x, y) = e(x² - y²). 0.4 0.3 0.5 -2 02 -0.5 y