Home /
Expert Answers /
Statistics and Probability /
1-a-given-the-data-representing-test-scores-in-a-chemistry-class-construct-a-grouped-frequency-pa511
(Solved): 1.) a.) Given the data representing test scores in a chemistry class, construct a grouped frequency ...
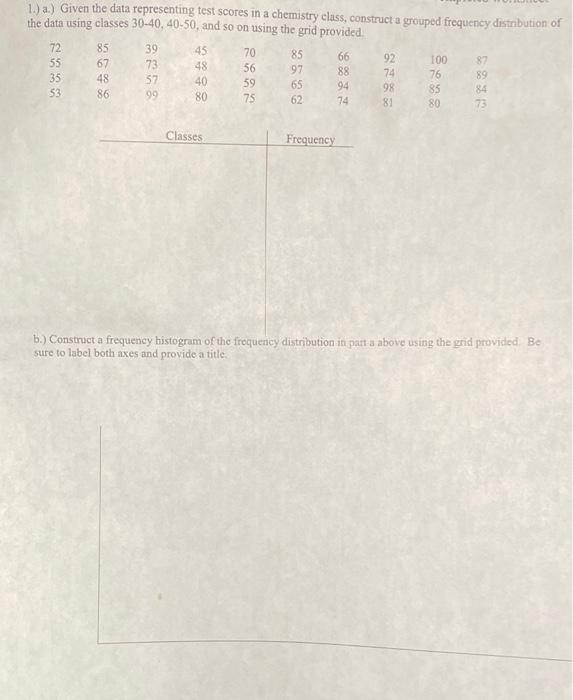
1.) a.) Given the data representing test scores in a chemistry class, construct a grouped frequency distribution of the data using classes \( 30-40,40-50 \), and so on using the grid provided. \begin{tabular}{l|c} Classes & Frequency \\ \hline & \\ a frequency histogram of the frequeacy distribution in patt a above using the grid provided. Be \end{tabular} b.) Construct a frequency histogram of the sure to label both axes and provide a title.