Home /
Expert Answers /
Earth Sciences /
1-create-a-graph-of-the-following-data-you-may-use-the-graph-paper-provided-pa770
(Solved): 1. Create a graph of the following data. You may use the graph paper provided ...
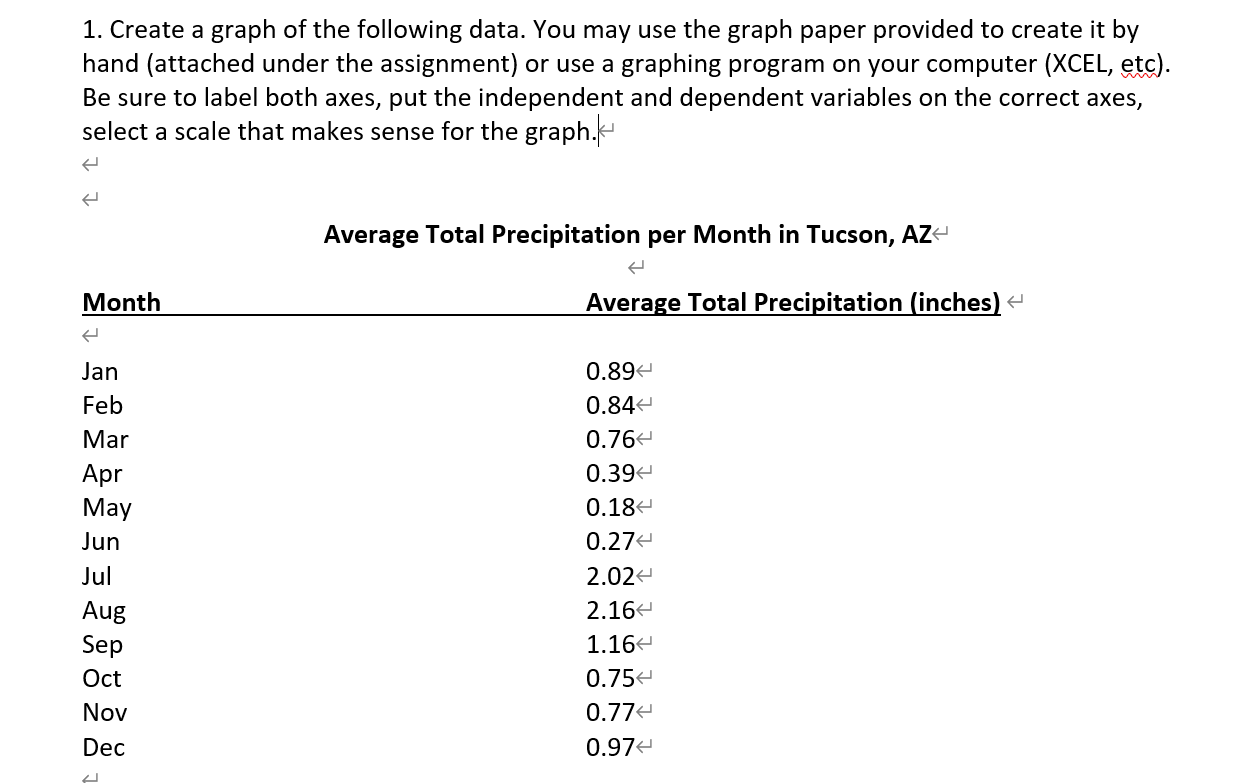
1. Create a graph of the following data. You may use the graph paper provided to create it by hand (attached under the assignment) or use a graphing program on your computer (XCEL, etc). Be sure to label both axes, put the independent and dependent variables on the correct axes, select a scale that makes sense for the graph. Average Total Precipitation per Month in Tucson, AZ
Expert Answer
IntroductionA bar graph for precipitation shows the amount of rainfall or snowfall in different periods of time or locations. The vertical axis on the