Home /
Expert Answers /
Calculus /
1-nbsp-the-figure-above-shows-the-graph-of-f-39-the-derivative-of-the-function-f-on-the-closed-inter-pa545
(Solved): 1. The figure above shows the graph of f', the derivative of the function f on the closed inter ...
1.
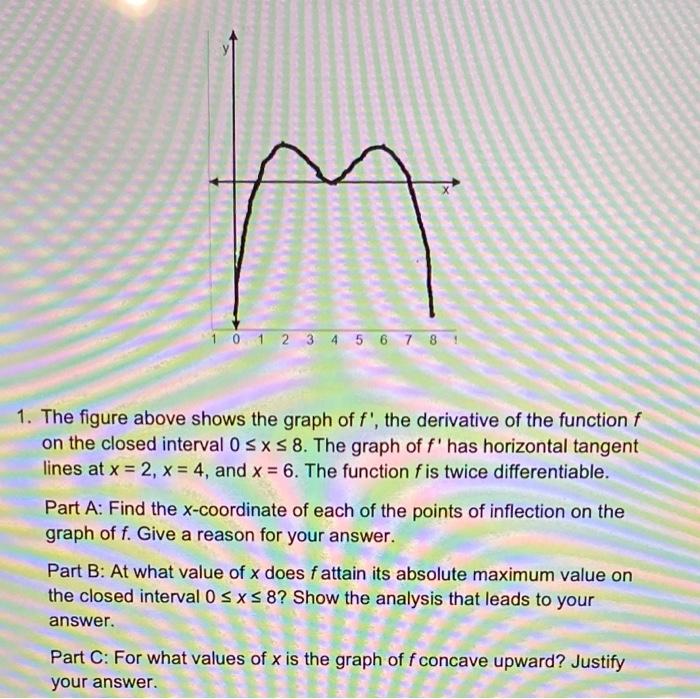
The figure above shows the graph of f', the derivative of the function f on the closed interval 0 <= x <= 8 The graph of f' has horizontal tangent lines at x = 2 x = 4 , and x = 6 The function f is twice differentiable.
Part A: Find the x-coordinate of each of the points of inflection on the graph of f. Give a reason for your answer.
Part B: At what value of x does fattain its absolute maximum value on the closed interval 0 <= x <=8? Show the analysis that leads to your answer.
Part C: For what values of x is the graph of f concave upward? Justify your answer.
The figure above shows the graph of \( f^{\prime} \), the derivative of the function \( f \) on the closed interval \( 0 \leq x \leq 8 \). The graph of \( f^{\prime} \) has horizontal tangent lines at \( x=2, x=4 \), and \( x=6 \). The function \( f \) is twice differentiable. Part A: Find the \( x \)-coordinate of each of the points of inflection on the graph of \( f \). Give a reason for your answer. Part B: At what value of \( x \) does \( f \) attain its absolute maximum value on the closed interval \( 0 \leq x \leq 8 \) ? Show the analysis that leads to your answer. Part C: For what values of \( x \) is the graph of \( f \) concave upward? Justify your answer.
Expert Answer
Solution (1) Part (a): point of inflection is the point where second derivative of function f is zero. So , at point of inflection f’’ = 0 now we have