Home /
Expert Answers /
Calculus /
1-point-the-figure-below-shows-the-graph-of-f-and-the-graph-of-its-local-linearization-l-pa807
(Solved): (1 point) The figure below shows the graph of \( f \) and the graph of its local linearization \( l ...
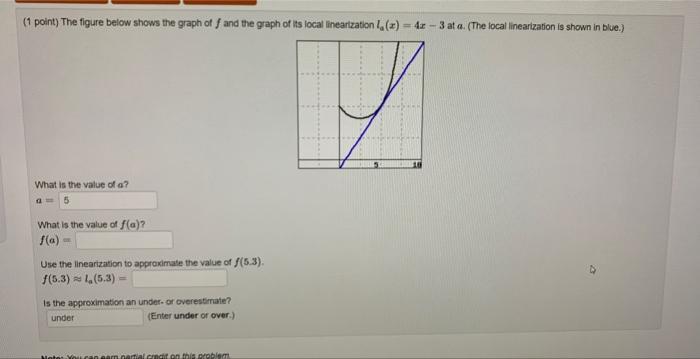
(1 point) The figure below shows the graph of \( f \) and the graph of its local linearization \( l_{a}(x)=4 x-3 \) at \( a \). (The local linearization is shown in blve.) What is the value of a? \[ a= \] What is the value of \( f(a) \) ? \[ f(a)= \] Use the linearization to aporaximate the value of \( f(5.3) \). \[ f(5.3) \approx I_{a}(5.3)= \] Is the approximation an under- or overestriate? (Enter under or over.)