Home /
Expert Answers /
Economics /
10-economic-freedom-and-economic-performance-the-x-axis-of-the-following-graph-categorizes-countri-pa538
(Solved): 10. Economic freedom and economic performance The X-axis of the following graph categorizes countri ...
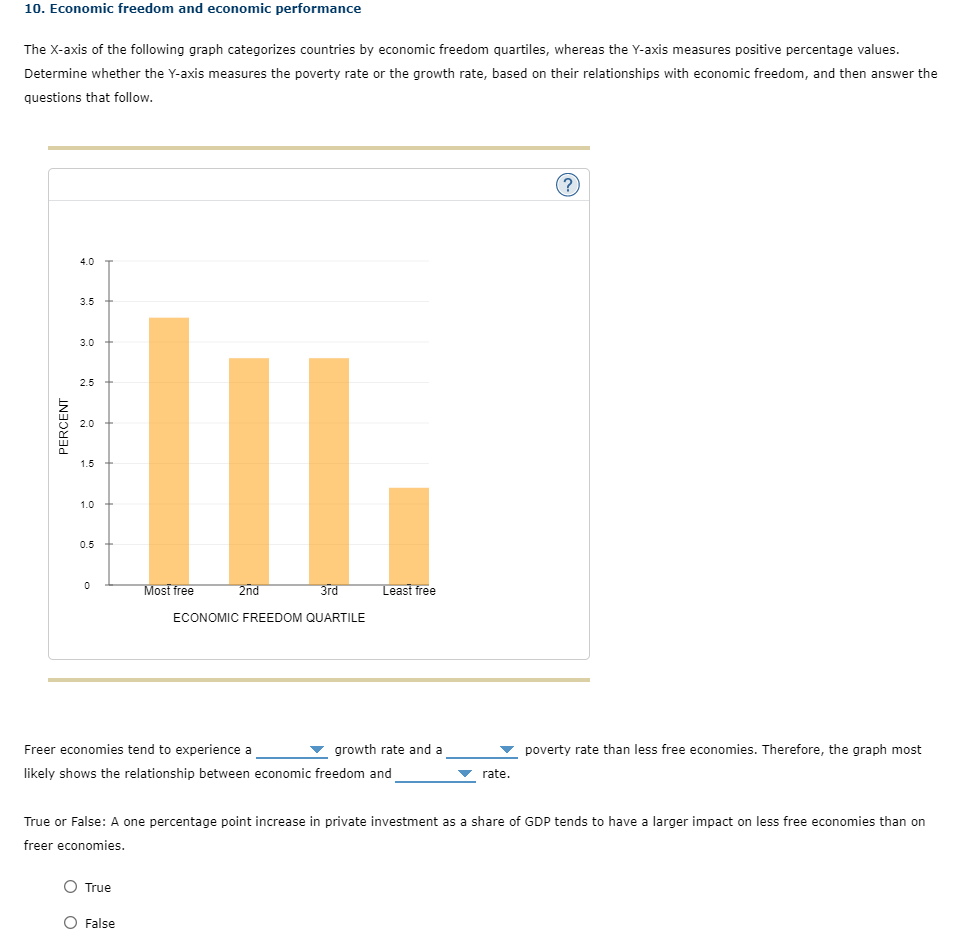
10. Economic freedom and economic performance The -axis of the following graph categorizes countries by economic freedom quartiles, whereas the -axis measures positive percentage values. Determine whether the -axis measures the poverty rate or the growth rate, based on their relationships with economic freedom, and then answer the questions that follow. Freer economies tend to experience a growth rate and a likely shows the relationship between economic freedom and poverty rate than less free economies. Therefore, the graph most rate. True or False: A one percentage point increase in private investment as a share of GDP tends to have a larger impact on less free economies than on freer economies. True False