Home /
Expert Answers /
Other /
13-2-develop-two-other-plans-for-the-mexican-roofingmanufacturer-described-in-ezmaples-1-to-4-pages-
(Solved): 13.2 Develop two other plans for the Mexican roofingmanufacturer described in Ezmaples 1 to 4 (pages ...
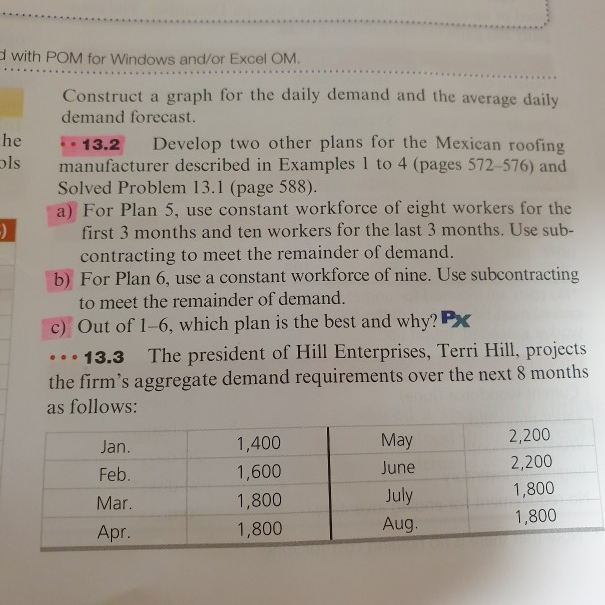
13.2 Develop two other plans for the Mexican roofingmanufacturer described in Ezmaples 1 to 4 (pages 572-576) andSolved Problem 13.1 (page 588).
a) For plan 5, use constant workforce of eight workersfor the first 3 months and ten workers for the last 3 months. Usesub-contracting to meet the remainder of demand.
b) For Plan 6, use a constant workforce of nine. Use subcontractingto meet the remainder of demand.
c) Out of 1-6, which plan is the best and why?
please 13.2
Please hurry up.
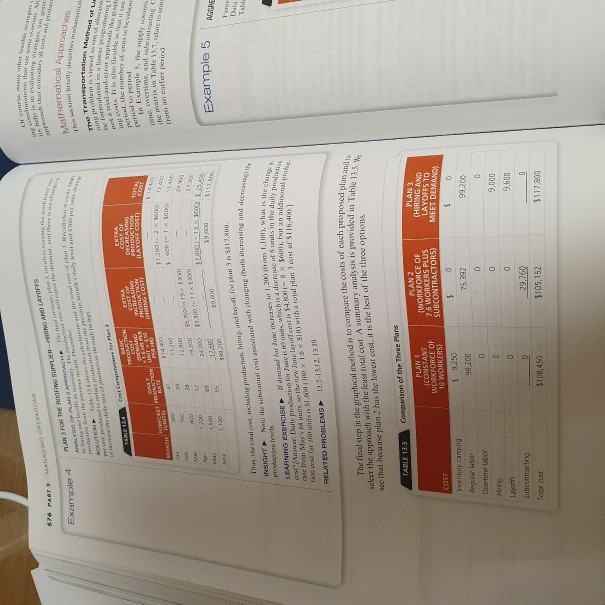
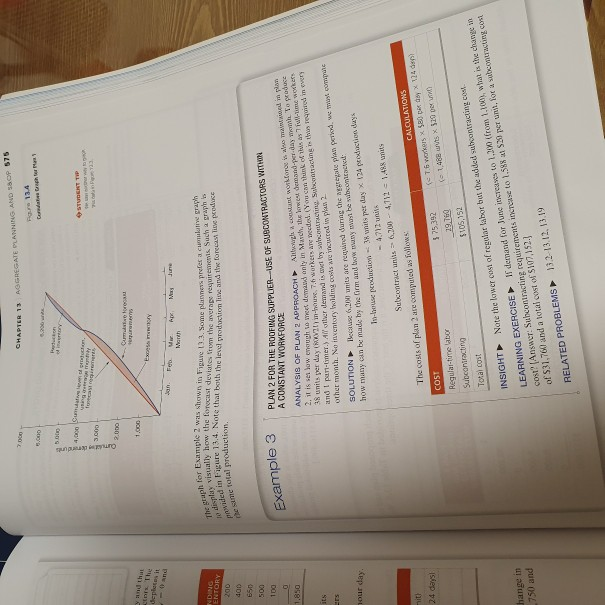
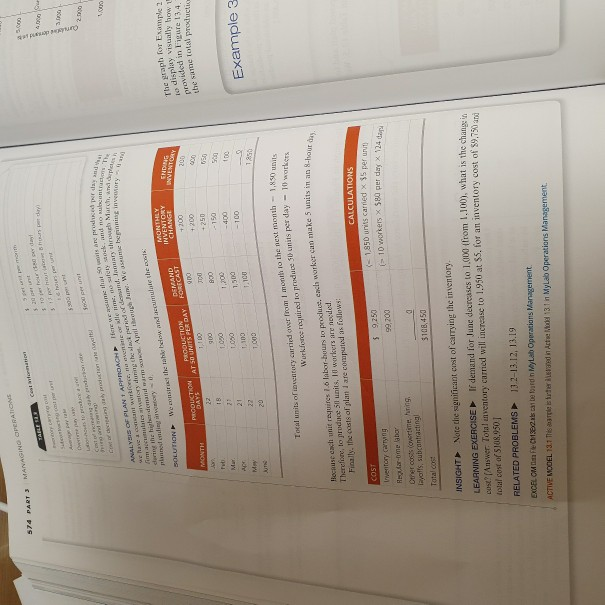
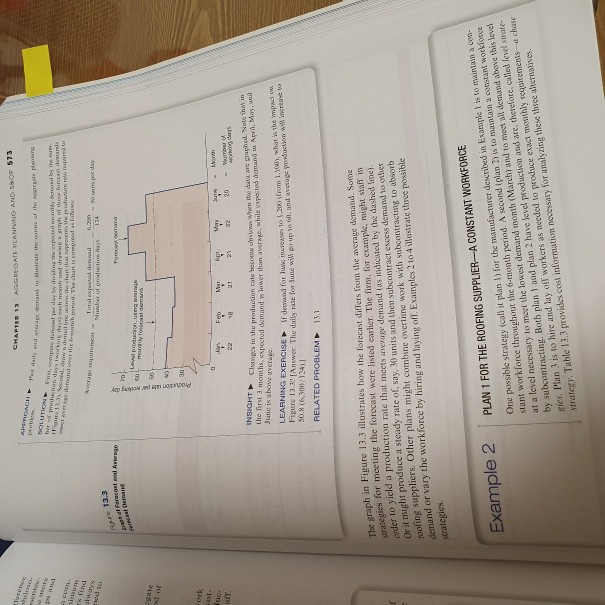
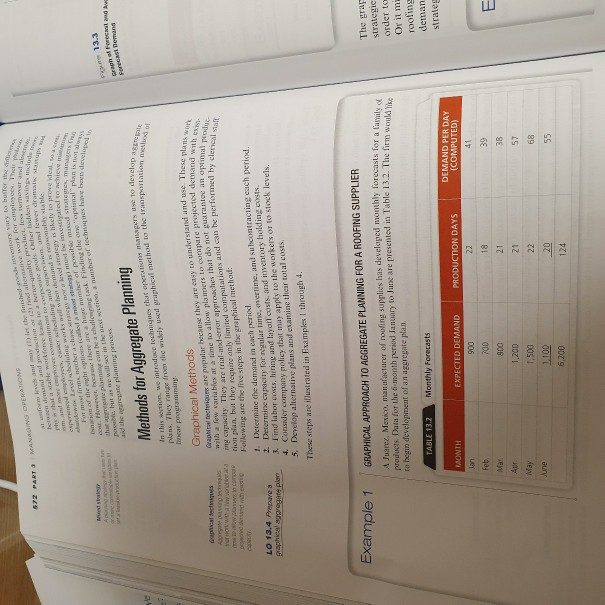
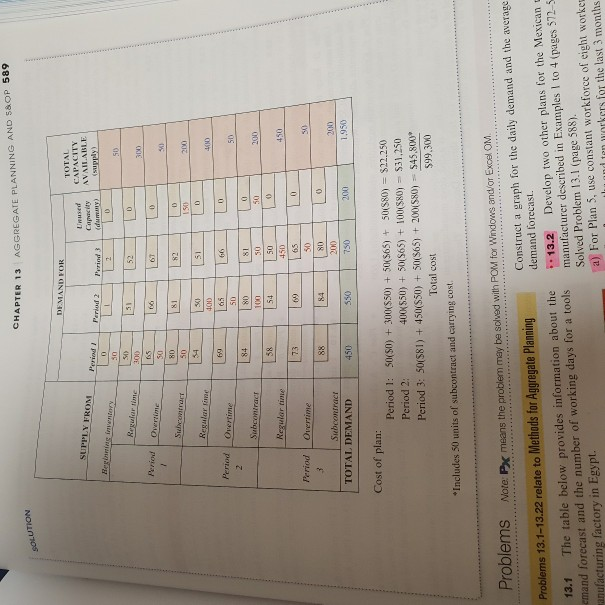
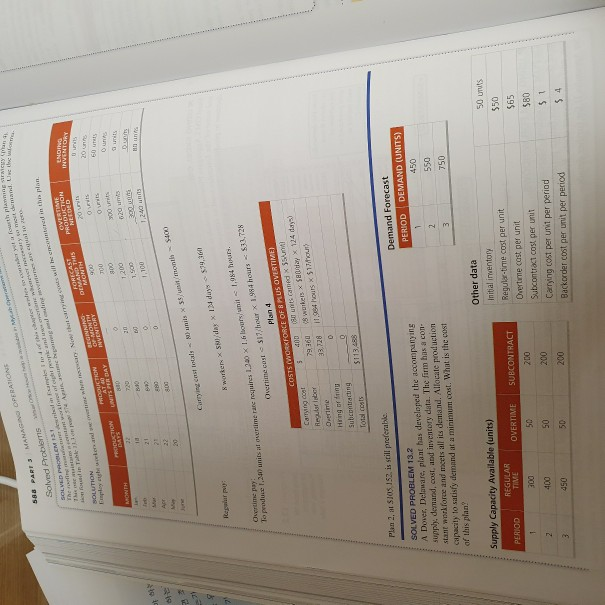
Class INS The TER ARCH Mathematical Approach The braly destinac Nem is viwawa Transportation method of Tandora DIE LIM the number will be E ESO convenime , and conte ihmettelo un Nele lost in the has increasing and ranch LEARNING EXERCISEI den storm 1. What is the han to the Junolauleon 34 , SSL but an admob olur . olor de chis orci Sinine days The na siep in the graphical method is 10 compare the costs of Cichoposed pidants select the approach with the least total cost . A Summary analysis is provided in Table 13.5 . We CE No pod NON Tra pod L - 13100 1243 HANS OPERATOR 576 Farra PLANS FOR THE ROOFING SUPPLIENING AND LAYOFFS ALORANSACCH the to Exemple 4 Le bly wearing mited way CNC Plan mot TABLE 12 PRIN COST OF cast CONTOH LAYOFF COST DERING COSTI MONTH UNITS CASTRODUCTION UNIT BATE PERE 514.00 COS TORIAL 11 $1.2001 - 21000 36004-11 12.10 W Feb MA JE 9.2000 2001 39 JOSTI 3200 1920 45 59000 ST Example 5 MY 19,00 TUS Thus the local cliniche production and buy for $11.. Data Preciou leche Do for mits is 1.600 300x16 ) with a tonalplom.com 51166) RELATED PROBLEMS 13.2-13.12.13.19 see that because plan has the lowest oost, it is the best of the three options Comparison of the Three Plans TABLE 13.5 PLAN 2 ( WORKFORCE OF 7.6 WORKERS PLUS SUBCONTRACTORS) PLAN 1 CONSTANT WORKFORCE OF 10 WORKERS) $ 5.250 95.260 PLAN 3 (HIRING AND LAYOFFS 70 MEET DLMAND) D. 99,200 COST 0 $ 75,392 wento carrying Regular babar Overture labor D D 0 0 0 9,000 a 9,600 0 VO Layoffs Subcontracting Tole cost 0 29,760 $105,152 $117.00 The graph for Example 2 Wit NOWI in Figure 3.3 . Some platne pretragraph peu in figure 11.4 . Note that both the level production live and the core o produce o di visually how the forecast deviates from the average requirements . Such a graphs che STCHA production CHAPTER 13 AGGREGATE PLANNING AND SOP 575 For 134 Cart O STUDENT TYP Summer ang 3 UTEM 3.000 9.000 7 Culo thai 1.000 Ex depletin Jan. June Wer Month ENTORY 200 400 500 100 Example 3 A CONSTANT WORKFORCE 1.850 IS PLAN 2 FOR THE ROOFING SUPPLIER--USE OF SUBCONTRACTORS WITHIN ANALYSIS OF PLAN 2 APPROACH Aulul comunt workforce is to seduce ses low enough to inert demand only in March, the breas demon-per-day manila to protece Sunits per day 2 -house. 76 workers are seedol. You can llunk of the as followers I puntimer. Allir demand is set by wahacontracmg Subcentracting is the required in every other month. No inventory holding costs we cured in plan 2 SOLUTION Beruse 6.200 units are required during the greate plan periodwe comprare how many can be made by the Grm and low any way be subcontracte: In-boue peduction - 3 vntprestay x 124 production days - 4.772 Subcontract units 6.300 - 4792 - 1.488 units The costs of plan 2 are computed as follows CALCULATIONS COST (e 75 workers x 58 x 14 de Regular-time labor (14Beurts x 520 ) Subcontracting Total cost hour day: hit 24 days 29749 $105,152 INSIGHT Note the lower cost of regular labor but the added subcontracting co LEARNING EXERCISE ? I demand for June increases to 1.0 (from 1.100, what is the change in cost? Answer: Subcontracting requirements increase to 1.588 * $20 per unit for a contracting cost of $31.700 and a lotal cost of $102,152.1 RELATED PROBLEMS 13.2-13.12, 13:19 750 and 574 PAT MANAGING CAO 5 CURS ON have to do les into the superiodam . the March the hybem Alph . We nemory The graph for Emple the sathe total production Hochschule Colabor - hoboproge worker can make its about 5.000 Cear TABLE sum 4.000 1000 pl ANALYSIS OF PLANT AFTPROACH We the table for the ???????? SOLUTION UNVENTORY to display visually how provided in Figure 134 PDOUCTION AT 50 UNITS PER DAY RORECAST 900 PRODUCTION DAYS MONTHLY INVENTORY CHANGE +200 +200 -250 -150 -400 -TCO 000 22 1B . Tube 100 100 100 1000 1.000 100 1.000 2.500 Example 3 21 22 100 . 1,850 Treat unitentory carried over from 1 month to the next month - 1.850 mins Workforce required to prodo 30 units per day - 10 workers Therefore, to produce 5l units, 10 workers are noted Finally, the costs of plan are computed as follow CALCULATIONS - 1850 units carried x $5 per unit) ( 10 workers x 580 per day 124 dapi COST 5 9.250 99,200 Regular-me anor Omer costs overtime ning Tayolls, subcontracting Total cost 3 3106453 INSIGHT Note the significant cost of carrying the inventory LEARNING EXERCISE ? If demand for June decreases to 1.000 (from 1.100), what is the change in cost? Answer: Total inventory carried will increase to 1.950 at 55. for an inventory cost of 89,750 ani total cost of S108,950 RELATED PROBLEMS 132-13.12, 13.19 EXCEL OM 1382 bed nylab Operations Management ACTIVE MODEL 13.1 This reserved in the 13.1 in MyLab Operations Management. als when the GOLUTION . dum devording the could be the acht Wir sind more Decacak CHAPTER 13 AGGREGATE PLANNING AND SHOP 573 Voo ?????? ab Wote 1 and um Totodom.al Average Number 0,20 - nowy 124 13.3 For 70 20 production, wegge moord Production rate per day 50 of OF 30 Mary FOD 10 ar - Non mer ng dans . Meer 21 22 21 20 Changes in the production cote come ci Win the data are grachel. Note that in INSIGHT Junc is above average LEARNING EXERCISE If demand for Juin increases to 200 Crom 1.100), what is the main Figure 13.3 Answer: The daily rate for Su will go up 10 ), and werage production will increase to 50.8 (6,0/124)1 RELATED PROBLEM 13.1 The graph in Figure 13.3 illustrates how the forecast differs from the average demand. Some sarategies for meeting the forecast were listed carlier. The firm, for example, might stafi in order to yield a production rate that meets average demand as indicated by the dashed line) Or it might produce a steady rate of, say, 30 units and then subcontract exces demand to other roofing suppliers. Other plans might combine overtime work with subcontracting to absorb demand or vary the workforce by hiring and laying oll. Examples 2 10 4 lestrate the possible strategies Example 2 PLAN 1 FOR THE ROOFING SUPPLIER-A CONSTANT WORKFORCE One possible strategy (call it plan for the manufacturer described in Example is to maintain.com stant workforce throughout the 6-month period. A second (plan is to maintam a constant workforce at a level necessary to meet the lowest demand month (March) and to meet all demand above this level by subcontracting. Both plan 1 and plan 2 have level production and are therefore called level state- gies. Plan 3 is to hire and lay of workers as needed to produce exact wontbly requirements - chase strategy. Table 13.3 provides cost information necessary for analyzing these three alternatives handdatorn for closes canonicory but panier PHOT predam su lewer drama Further verstellen Montbuchhemm misma them and the beached to chovem padalona in the past In this we models that hapers c10 DevOps plants . They range from the widely un gruphical ethod to the transportation wedi Grapatections are popular because they are easy to understand and use . These plans with a lew arables al me low price Project With Sampe Cerden nicode Ne but will in the world , anber or loose bendol BARCA on plan , but they require only limited computations and can be performed by clerical wall ADANALI OPERATIONS 572 PART 3 o 13.3 and the planning pro Forest Dem Methods for Aggregate Planning Ticar programming Graphical Methods optimal polit- apical ferits Yoweriala was como Doudig caract: They are trial and enfor approaches that do not guarantee an Following are the live steps in the graphical method: Determine the demand in each period 2 Determine capacity for regular time, overtime, and subcontracting cach period. Find labor costs, Juring and Inyolcasts, and inventory holding costs. Consider company policy that may apply to the workers or to stock levels. 5 Develop alternative plans and examine their total costs These steps are illustrated in Fixamples through 4. LO 13.4 Prepare a graphical aggregate plan Example 1 GRAPHICAL APPROACH TO AGGREGATE PLANNING FOR A ROOFING SUPPLIER Juarez, Mexico, manufacturer of roofing supplies has developed monthly forecasts for a family products Data for the month period January to June are presented in Table 13.2. The firm would like to begin development of an aggregate plan The gras strategic order to Orit me roofing deman strales TABLE 13.2 Monthly Forecasts DEMAND PER DAY (COMPUTED) MAONTH lan EXPECTED DEMAND 900 700 PRODUCTION DAYS 22 41 Feb 18 E Mar 21 21 39 36 57 AUT 800 1,200 1,500 1.100 6,200 22 May June 68 20 55 124 AGGREGATE PLANNING AND S&OP 589 CHAPTER 13 SOLUTION DEMAND FOR TOTAL CAPACITY AVAILABLE upply) SUPPLY FROM Perind Period Furiod 3 2 Capacity (2 D Hegas inventory SO SU > 31 D Regular time 52 310 100 5 50 80 06 6T 0 MI 81 2 Subcontract 50 34 D 50 200 SI Regalar Home MO 69 66 Period 2 Orertime 50 100 65 SD 80 100 54 84 u Subcontract 50 200 58 Regular time 150 73 09 81 50 SO 450 65 50 80 200 750 0 SA 88 84 Period Overtime 3 Subcontract TOTAL DEMAND 200 1.950 450 SSO 200 Cost of plan: Period 1: 50(SO) + 300(550) + 50(365) + 50(580) = $22.250 Period 2: 400X550) + 50(565) + 100(580) - $31.250 Period 3: 50(581) + 450(550) + 50(565) + 200(580) - $45.800 Total cost $99.30 *Includes 50 units of subcontract and carrying cost. Note: Px means the problem may be solved with POM for Windows and/or Excel OM. Problems Problems 13.1-13.22 relate to Methods for Aggregate Planning 13.1 The table below provides information about the cmand forecast and the number of working days for a tools manufacturing factory in Egypt. Construct a graph for the daily demand and the average demand forecast 13.2 Develop two other plans for the Mexican manufacturer described in Examples 1 to 4 (pages 572-5 Solved Problem 13.1 (page 388). a) For Plan 5, use constant workforce of eight works und te workers for the last 3 months MANACO OPERATONS Solved Problems word TUNES El Ch DEA SA PART 3 Tom gewiesen escriere secret. Noe het oeryone ones will he country in the min. SOLVEDPOLEN PRODUCTION NERED ENDING INVENTORY SOLUTION BESIMI INVENTORY bus PRODUCTION ATO LIMITS PER DAY FOCUSTOM 100 MONTH 720 900 1.200 1,500 1.100 DUITS 1.2.0 21 ART 22 20 Constatals x 55/month - 5400 worker x Say I days $99.260 To podwe 200 units at overtime rare rires 120 x 1.6 loots/ unit -- 1,984 bours O crime cost 317/hour X 1,984 hours - $32728 Plan 4 COSTS WORKFORCE OF 8 PLUS OVERTIME) Carrying cost Camed x 3 featrica) 78.16 wules sabay X 124 days 33,728 11.954 hours x Sour Hiring or Subcontracting Total con $113,658 Plan 1. ar SIOS 152, is still preferable. SOLVED PROBLEM 13.2 A Dover, Delaware plant has developed the accompag supply, demand, cost, and inventory data. The firm has a con stant workforce and meets all its demand, Allocate production capacity to satisfy demand at a minimum cost. What is the cost of this plan Demand Forecast PERIOD DEMAND (UNITS) 450 2 550 3 750 Supply Capacity Available (units) REGULAR PERIOD TIME OVERTIME SUBCONTRACT Other data Initial inventory Regular.time cost per unit Overtime cast per unit Subcontract cost per unit Carrying cost per urut per period Backorder cost per unit per period 50 Uruits 550 $65 $80 $1 50 200 300 2 400 200 50 3 450 50 200 with POM for Windows and/or Excel OM. he als Construct a graph for the daily demand and the average daily demand forecast. .. 13.2 Develop two other plans for the Mexican roofing manufacturer described in Examples 1 to 4 (pages 572-576) and Solved Problem 13.1 (page 588). a) For Plan 5, use constant workforce of eight workers for the first 3 months and ten workers for the last 3 months. Use sub- contracting to meet the remainder of demand. b) For Plan 6, use a constant workforce of nine. Use subcontracting to meet the remainder of demand. c) Out of 1-6, which plan is the best and why? Px • 13.3 The president of Hill Enterprises, Terri Hill, projects the firm's aggregate demand requirements over the next 8 months as follows: Jan. 1,400 May 2,200 Feb. 1,600 June 2,200 Mar. 1,800 1,800 July Apr. 1,800 1,800 Aug ...
Expert Answer
Answer to 13.2 Develop two other plans for the Mexican roofing manufacturer described in Ezmaples 1 to 4 (pages 572-576) and Solv...