Home /
Expert Answers /
Statistics and Probability /
2-40-the-following-data-are-shaped-roughly-like-a-normal-distribution-discussed-in-chapter-6-ta-pa741
(Solved): 2.40. The following data are shaped roughly like a normal distribution (discussed in Chapter 6). \ta ...
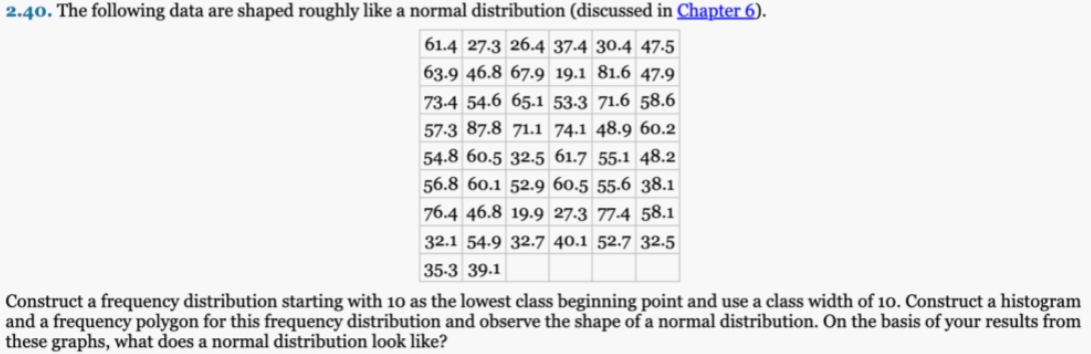
2.40. The following data are shaped roughly like a normal distribution (discussed in Chapter 6). \table[[61.4,27.3,26.4,37.4,30.4,47.5],[63.9,46.8,67.9,19.1,81.6,47.9],[73.4,54.6,65.1,53.3,71.6,58.6],[57.3,87.8,71.1,74.1,48.9,60.2],[54.8,60.5,32.5,61.7,55.1,48.2],[56.8,60.1,52.9,60.5,55.6,38.1],[76.4,46.8,19.9,27.3,77.4,58.1],[32.1,54.9,32.7,40.1,52.7,32.5],[35.3,39.1,,,,]] Construct a frequency distribution starting with 10 as the lowest class beginning point and use a class width of 10 . Construct a histogram and a frequency polygon for this frequency distribution and observe the shape of a normal distribution. On the basis of your results from these graphs, what does a normal distribution look like?