Home /
Expert Answers /
Economics /
3-revenue-curves-the-blue-curve-on-the-following-graph-represents-the-demand-curve-facing-a-firm-t-pa152
(Solved): 3. Revenue curves The blue curve on the following graph represents the demand curve facing a firm t ...
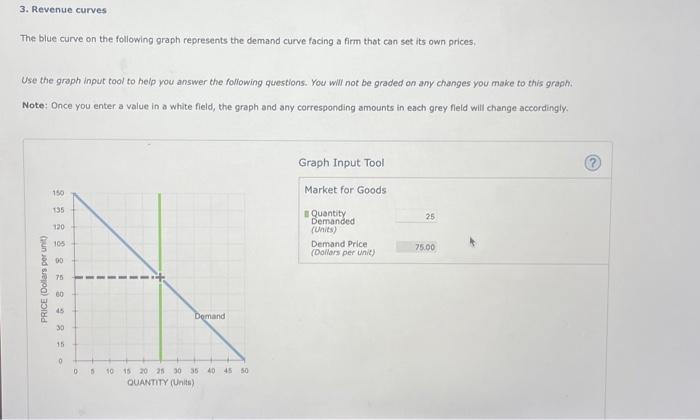
3. Revenue curves The blue curve on the following graph represents the demand curve facing a firm that can set its own prices, Use the graph input tool to help you answer the following questions. You will not be graded on any changes you make to this graph. Note: Once you enter a value in a white field, the graph and any corresponding amounts in each grey fleld will change accordingly.
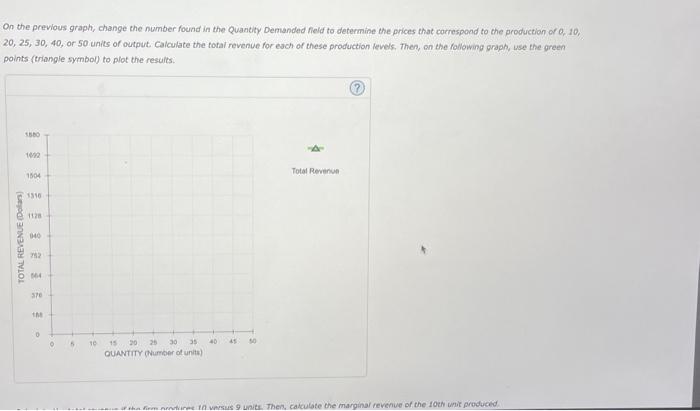
On the previous graph, change the number found in the Quanity Demanded fleld to determine the prices that correspond to the aroduction or o. 10 , 20, 25, 30, 40, or 50 units of output, Cakculate the fotal revenue for each or these production levels, Thee, on the following graph, use the green points (triangie symbol) to plot the resuits.
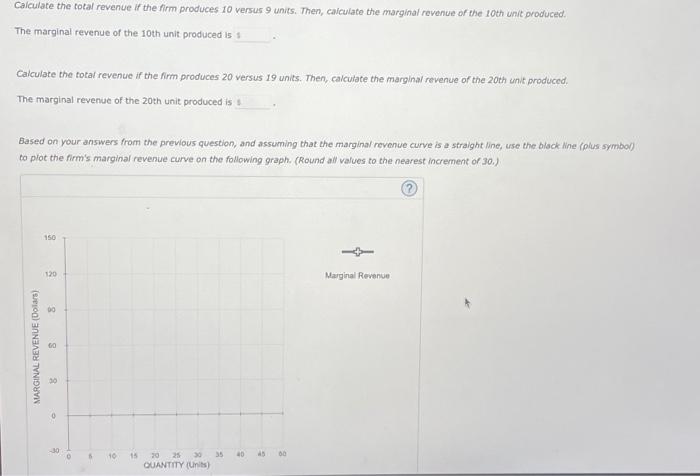
Caiculate the total revenue if the firm produces 10 versus 9 uniks. Then, calculate the marginal revenue of the 10 th unit produced. The marginal revenue of the 10 th unit produced is Caiculate the total revenue if the firm produces 20 versus 19 units. Then, calculate the marginal revenue of the 20 oth unit produced. The marginal revenue of the 20 th unit produced is Based on your answers from the previous question, and assuming that the marginal revenue curve is a straight line, use the bisck Nne (olus symbol) to plot the firm's marginal revenue curve on the following graph. (Round all values to the nearest increment or 30. )
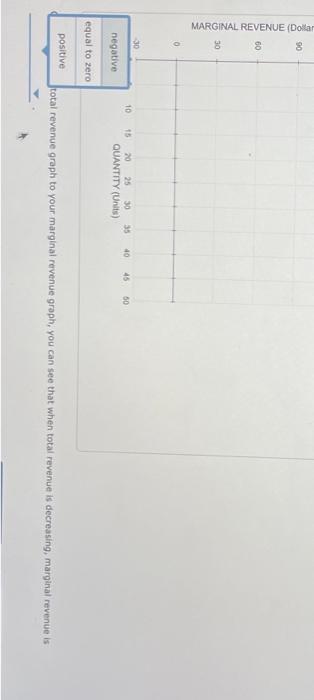
positive total revenue graph to your marginal revenue graph, you can see that when total revenue is deereasing, marginal revenue is