(Solved): ( 30 points) For a circuit diagram below
Draw a qualitative Bode plot (Gain vs Frequency), (j=\sqrt( ...
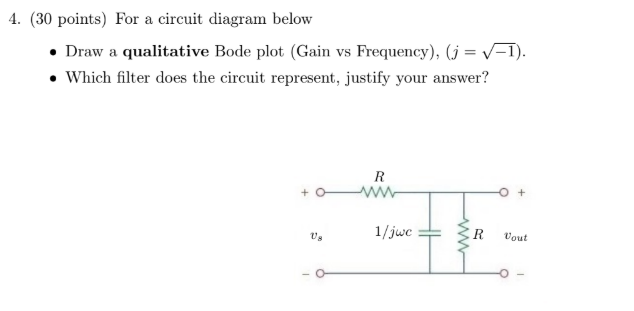
( 30 points) For a circuit diagram below
Draw a qualitative Bode plot (Gain vs Frequency), (j=\sqrt(-1)).
Which filter does the circuit represent, justify your answer?