Home /
Expert Answers /
Computer Science /
3d-plotting-assignment-create-a-3d-contour-plot-of-the-function-z-sin-x-y-python-h-pa688
(Solved): 3D PLOTTING ASSIGNMENT Create a 3D contour plot of the function z = sin (x + y) Python h ...
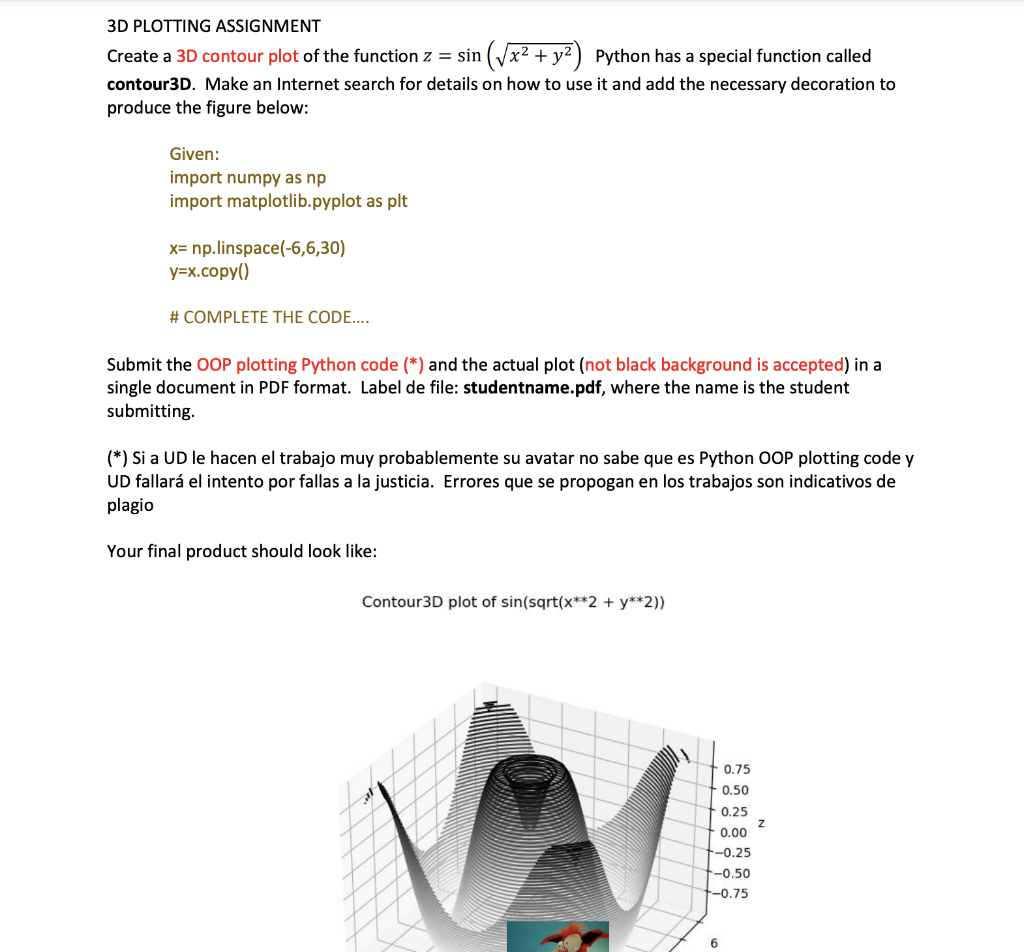
3D PLOTTING ASSIGNMENT Create a 3D contour plot of the function z = sin (??x² + y²) Python has a special function called contour3D. Make an Internet search for details on how to use it and add the necessary decoration to produce the figure below: Given: import numpy as np import matplotlib.pyplot as plt x= np.linspace(-6,6,30) y=x.copy() # COMPLETE THE CODE.... Submit the OOP plotting Python code (*) and the actual plot (not black background is accepted) in a single document in PDF format. Label de file: studentname.pdf, where the name is the student submitting. (*) Si a UD le hacen el trabajo muy probablemente su avatar no sabe que es Python OOP plotting code y UD fallará el intento por fallas a la justicia. Errores que se propogan en los trabajos son indicativos de plagio Your final product should look like: Contour3D plot of sin(sqrt(x**2 + y**2)) 0.75 0.50 0.25 Z 0.00 -0.25 -0.50 -0.75 6
Expert Answer
Solution Python Code: import numpy as np import matplotlib.pyplot as plt x = np.li