Home /
Expert Answers /
Electrical Engineering /
4-plot-the-root-locus-of-the-the-control-system-given-below-g-s-h-s-s-s-5-s-10-k-use-matlab-t-pa780
(Solved): 4. Plot the root Locus of the the control system given below G(s)H(s)=s(s+5)(s+10)k Use MATLAB t ...
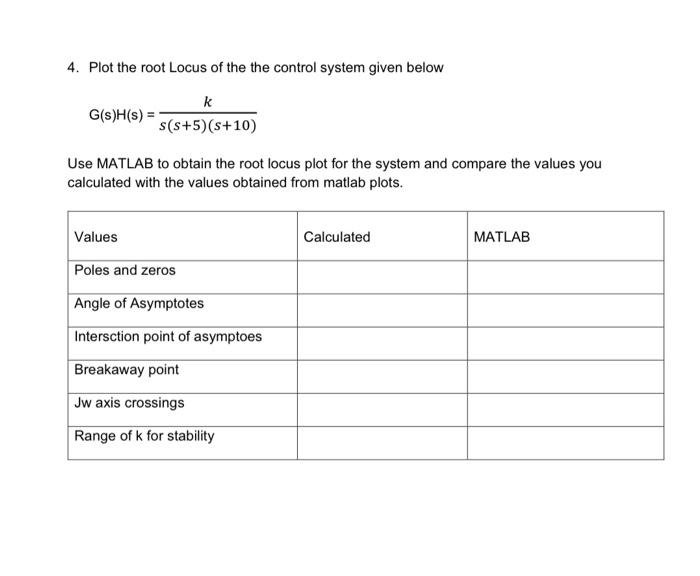
4. Plot the root Locus of the the control system given below Use MATLAB to obtain the root locus plot for the system and compare the values you calculated with the values obtained from matlab plots.
Expert Answer
The given open loop system is G(s)H(s) = Poles : s= 0,-5,-10No zeroesP-Z = 3Angle of Aysmptotes : , q = 0, 1, 2, 3, .......?o = 60° , ?1 = 180° , ?2=300°Intersection of aymptotes : ? =