Home /
Expert Answers /
Economics /
4-the-diagram-below-shows-a-monopoly-and-perfectly-competitive-firm-in-the-same-graph-a-what-is-pa965
(Solved): 4. The diagram below shows a monopoly and perfectly competitive firm in the same graph. a. What is ...
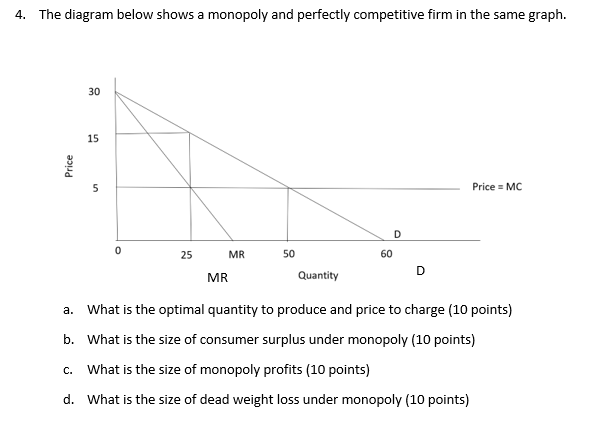
4. The diagram below shows a monopoly and perfectly competitive firm in the same graph. a. What is the optimal quantity to produce and price to charge (10 points) b. What is the size of consumer surplus under monopoly (10 points) c. What is the size of monopoly profits ( 10 points) d. What is the size of dead weight loss under monopoly (10 points)
Expert Answer
Step-1 4) optimal quantity and price charge under monopololy market is where MR=MC so