Home /
Expert Answers /
Chemistry /
4-the-following-graph-shows-the-fraction-of-particles-y-axis-in-a-sample-of-gas-with-a-given-spe-pa129
(Solved): 4. The following graph shows the fraction of particles (y-axis) in a sample of gas with a given spe ...
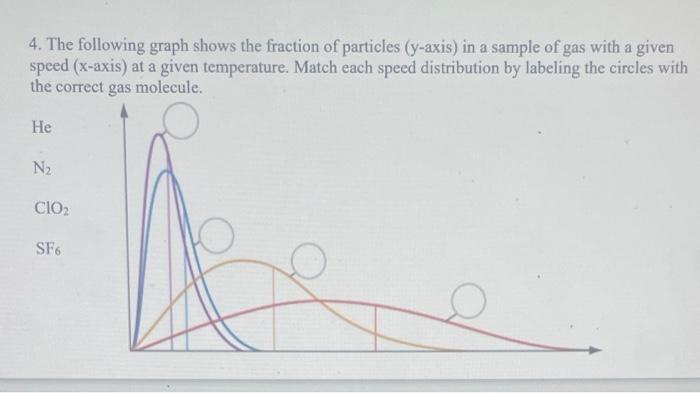
4. The following graph shows the fraction of particles (y-axis) in a sample of gas with a given speed ( -axis) at a given temperature. Match each speed distribution by labeling the circles with the correct gas molecule.