Home /
Expert Answers /
Calculus /
4-the-graph-shows-the-air-pressure-in-kilopascals-mathrm-kpa-inside-a-party-balloon-a-pa644
(Solved): 4. The graph shows the air pressure (in kilopascals \( (\mathrm{kPa}) \) ) inside a party balloon a ...
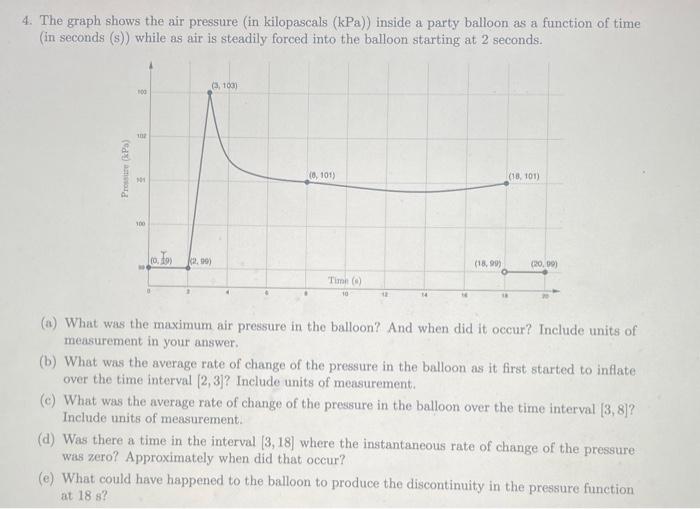
4. The graph shows the air pressure (in kilopascals \( (\mathrm{kPa}) \) ) inside a party balloon as a function of time (in seconds (s)) while as air is steadily forced into the balloon starting at 2 seconds. (a) What was the maximum air pressure in the balloon? And when did it occur? Include units of measurement in your answer. (b) What was the average rate of change of the pressure in the balloon as it first started to inflate over the time interval \( [2,3] \) ? Include units of measurement. (c) What was the average rate of change of the pressure in the balloon over the time interval \( [3,8] \) ? Include units of measurement. (d) Was there a time in the interval \( [3,18] \) where the instantaneous rate of change of the pressure was zero? Approximately when did that occur? (e) What could have happened to the balloon to produce the discontinuity in the pressure function at \( 18 \mathrm{8} \) ?
Expert Answer
(a) On the Y axis we have air pressure inside balloon Therofore maximum air Presuure will be maximum value attained by curve for Y axis. This happens