Home /
Expert Answers /
Statistics and Probability /
4-use-the-frequency-distribution-for-the-low-temperatures-from-exercise-2-to-construct-a-histogram-pa416
(Solved): 4. Use the frequency distribution for the low temperatures from Exercise 2 to construct a histogram ...
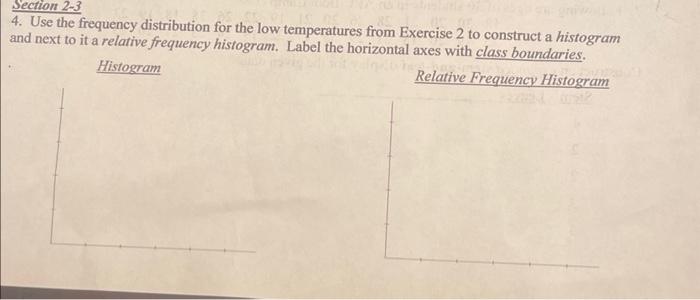
4. Use the frequency distribution for the low temperatures from Exercise 2 to construct a histogram and next to it a relative frequency histogram. Label the horizontal axes with class boundaries.
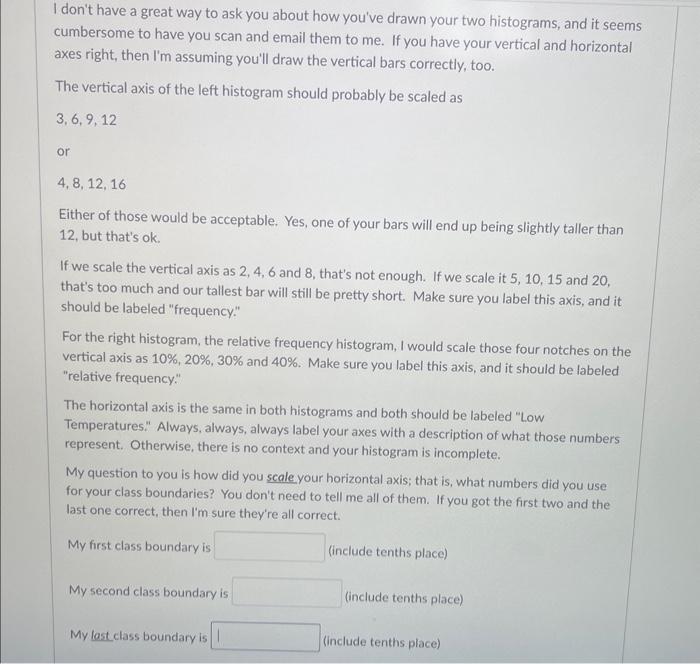
I don't have a great way to ask you about how you've drawn your two histograms, and it seems cumbersome to have you scan and email them to me. If you have your vertical and horizontal axes right, then I'm assuming you'll draw the vertical bars correctly, too. The vertical axis of the left histogram should probably be scaled as or Either of those would be acceptable. Yes, one of your bars will end up being slightly taller than 12 , but that's ok. If we scale the vertical axis as and 8 , that's not enough. If we scale it 5, 10,15 and 20, that's too much and our tallest bar will still be pretty short. Make sure you label this axis, and it should be labeled "frequency." For the right histogram, the relative frequency histogram, I would scale those four notches on the vertical axis as and . Make sure you label this axis, and it should be labeled "relative frequency." The horizontal axis is the same in both histograms and both should be labeled "Low Temperatures." Always, always, always label your axes with a description of what those numbers represent. Otherwise, there is no context and your histogram is incomplete. My question to you is how did you scaleyour horizontal axis; that is, what numbers did you use for your class boundaries? You don't need to tell me all of them. If you got the first two and the last one correct, then I'm sure they're all correct. My first class boundary is (include tenths place) My second class boundary is (include tenths place) My lastclass boundary is (include tenths. place)
Expert Answer
Answer:- The class boundaries for the horizontal axis could be determined based on the minimum and maximum values of the low temperatu