Home /
Expert Answers /
Economics /
5-exchange-rate-overshooting-the-following-graph-shows-the-short-run-supply-schedule-so-and-dem-pa400
(Solved): 5. Exchange-rate overshooting The following graph shows the short-run supply schedule (So) and dem ...
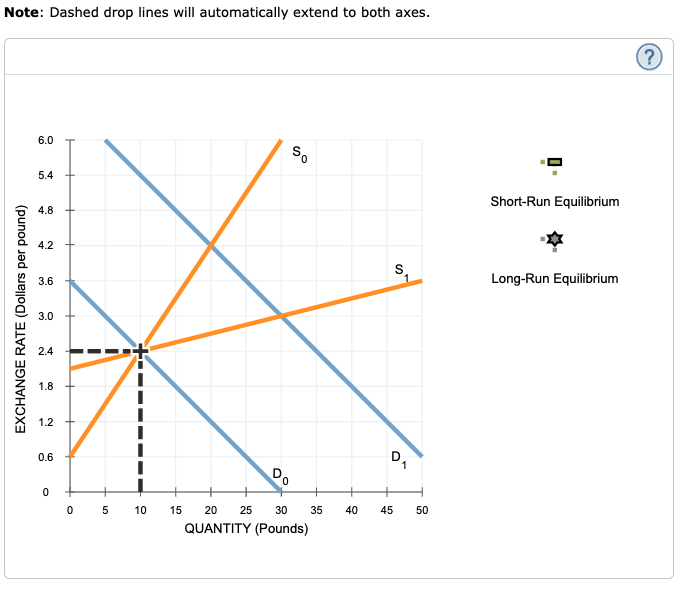
5. Exchange-rate overshooting The following graph shows the short-run supply schedule (So) and demand schedule (Do) for the British pound. S? denotes the long-run supply schedule of pounds. The initial equilibrium exchange rate is $2.40 per pound. Suppose that the demand for pounds increases to D?. On the graph, use the tan point (dash symbol) to indicate the short-run equilibrium exchange rate. Then use the grey point (star symbol) to indicate the long-run equilibrium exchange rate.
Note: Dashed drop lines will automatically extend to both axes. EXCHANGE RATE (Dollars per pound) 6.0 5.4 4.8 4.2 3.6 3.0 2.4 1.8 1.2 0.6 0 1 05 10 So 15 20 25 30 QUANTITY (Pounds) 35 40 45 S 1 1 50 Short-Run Equilibrium Long-Run Equilibrium (?)
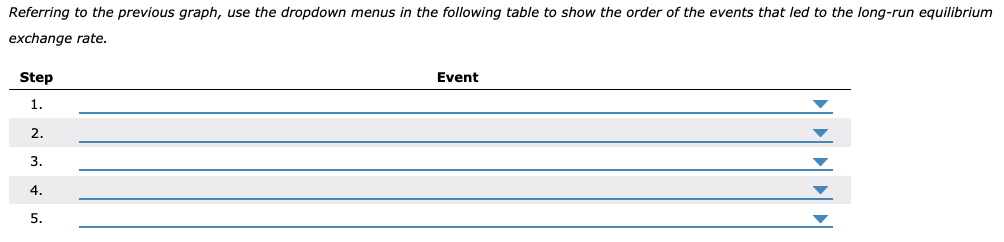
Referring to the previous graph, use the dropdown menus in the following table to show the order of the events that led to the long-run equilibrium exchange rate. Step 1. 2. 3. 4. 5. Event
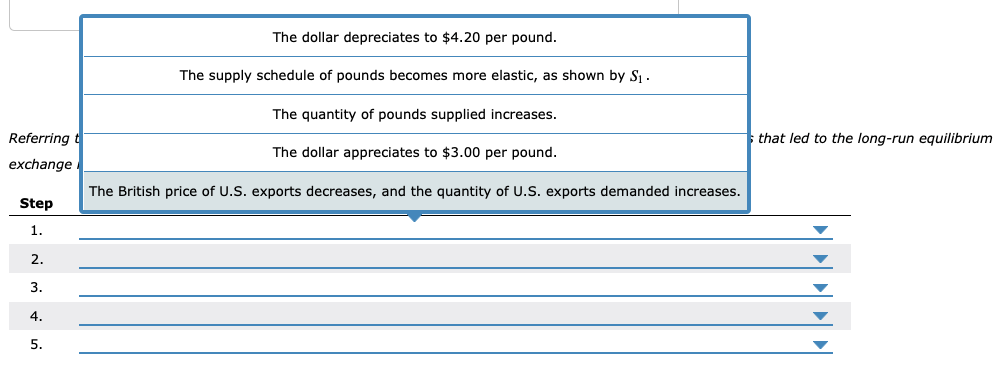
Referring t exchange Step 1. 2. 3. 4. 5. The dollar depreciates to $4.20 per pound. The supply schedule of pounds becomes more elastic, as shown by S?. The quantity of pounds supplied increases. The dollar appreciates to $3.00 per pound. The British price of U.S. exports decreases, and the quantity of U.S. exports demanded increases. that led to the long-run equilibrium