Home /
Expert Answers /
Statistics and Probability /
6-a-student-has-decided-to-display-the-results-of-his-project-on-the-number-of-hours-people-in-var-pa698
(Solved): 6. A student has decided to display the results of his project on the number of hours people in var ...
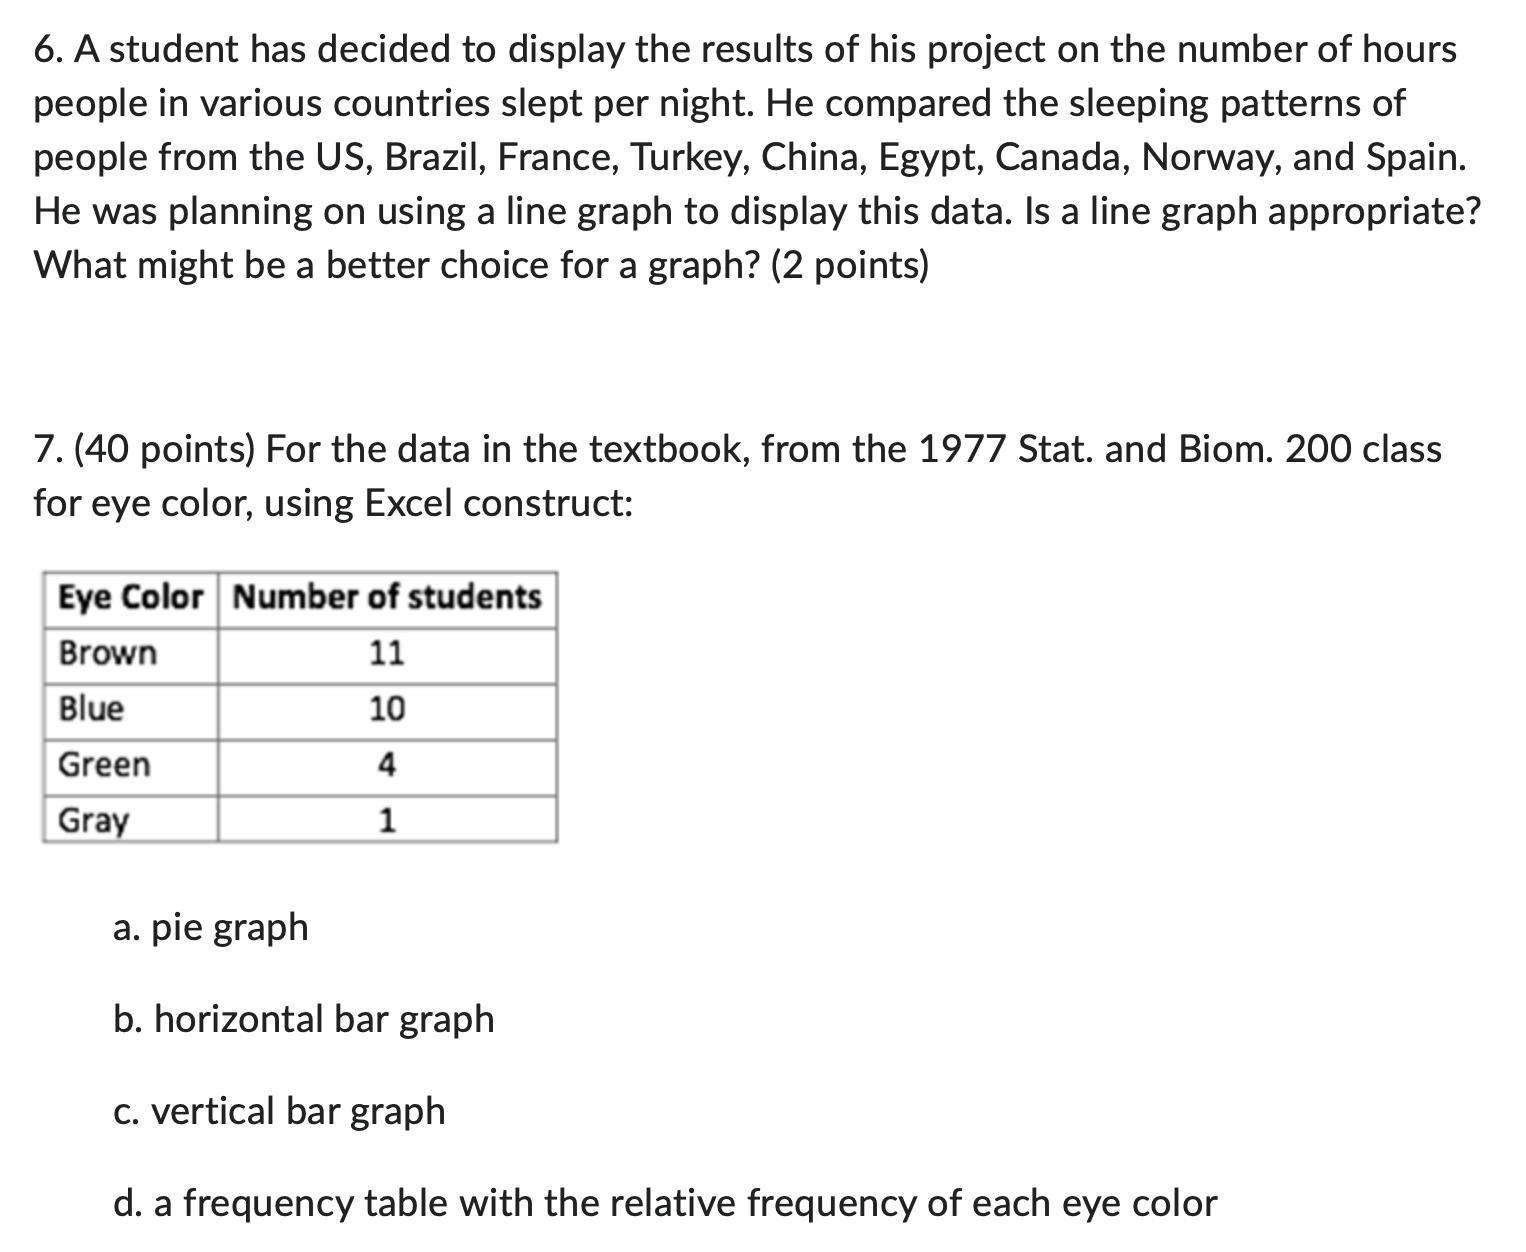
6. A student has decided to display the results of his project on the number of hours people in various countries slept per night. He compared the sleeping patterns of people from the US, Brazil, France, Turkey, China, Egypt, Canada, Norway, and Spain. He was planning on using a line graph to display this data. Is a line graph appropriate? What might be a better choice for a graph? (2 points) 7. ( 40 points) For the data in the textbook, from the 1977 Stat. and Biom. 200 class for eye color, using Excel construct: a. pie graph b. horizontal bar graph c. vertical bar graph d. a frequency table with the relative frequency of each eye color