Home /
Expert Answers /
Economics /
6-the-following-graph-depicts-the-market-for-oranges-a-study-finds-that-a-daily-glass-of-orange-j-pa154
(Solved): 6. The following graph depicts the market for oranges. A study finds that a daily glass of orange j ...
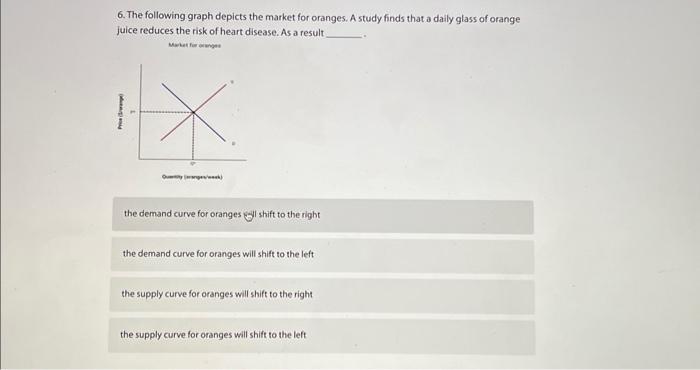
6. The following graph depicts the market for oranges. A study finds that a daily glass of orange juice reduces the risk of heart disease. As a result kiket fue emenes the demand curve for oranges l shift to the right the demand curve for oranges will shift to the left the supply curve for oranges will shift to the right the supply curve for oranges will shift to the left