Home /
Expert Answers /
Physics /
6-the-graph-below-shows-the-potential-energy-curve-of-a-particle-moving-along-the-x-axis-under-the-pa251
(Solved): 6. The graph below shows the potential energy curve of a particle moving along the x-axis under the ...
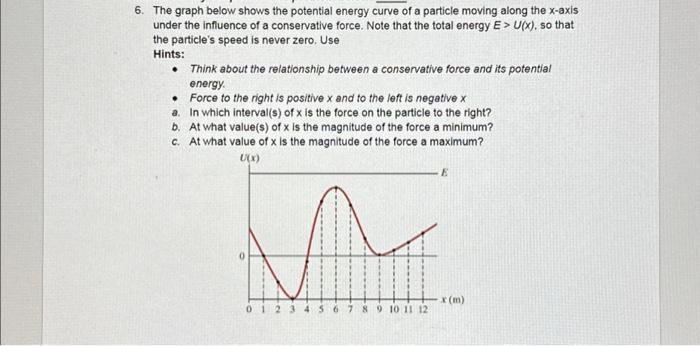
6. The graph below shows the potential energy curve of a particle moving along the x-axis under the influence of a conservative force. Note that the total energy E > U(x), so that the particle's speed is never zero. Use Hints: Think about the relationship between a conservative force and its potential energy. . Force to the right is positive x and to the left is negative x a. In which interval(s) of x is the force on the particle to the right? b. At what value(s) of x is the magnitude of the force a minimum? c. At what value of x is the magnitude of the force a maximum? U(x) E n 0 1 2 3 4 5 6 7 8 9 10 11 12 x (m)
6. The graph below shows the potential energy curve of a particle moving along the -axis under the influence of a conservative force. Note that the total energy . so that the particle's speed is never zero. Use Hints: - Think about the relationship between a conservative force and its potential energy. - Force to the right is positive and to the left is negative a. In which interval(s) of is the force on the particle to the right? b. At what value(s) of is the magnitude of the force a minimum? c. At what value of is the magnitude of the force a maximum?