Home /
Expert Answers /
Economics /
7-based-on-the-following-table-you-can-draw-4-dimensions-graphs-the-4-dimensions-graphs-indicate-pa854
(Solved): 7. Based on the following Table, you can draw 4 dimensions graphs. The 4 dimensions graphs indicate ...
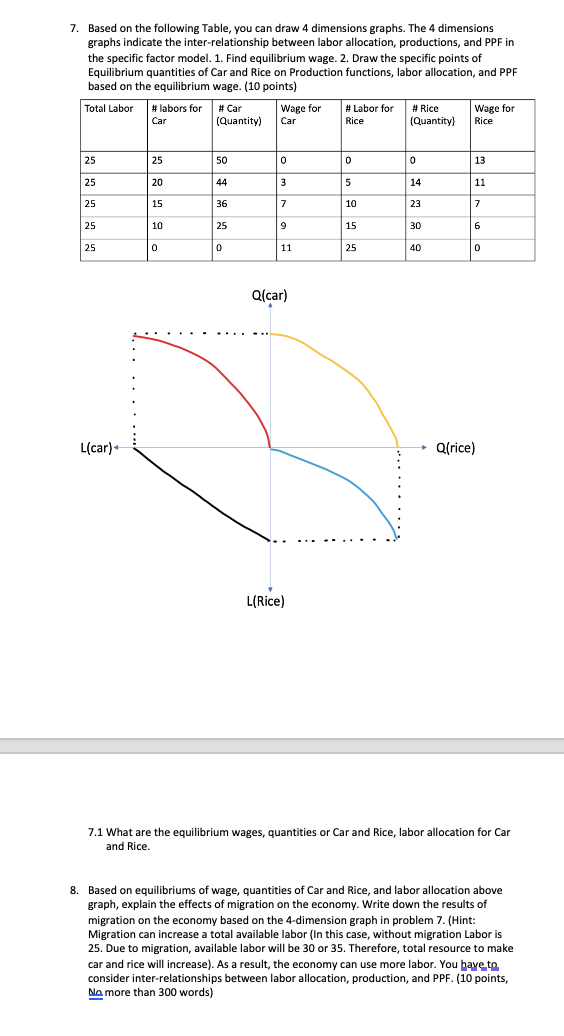
7. Based on the following Table, you can draw 4 dimensions graphs. The 4 dimensions graphs indicate the inter-relationship between labor allocation, productions, and PPF in the specific factor model. 1. Find equilibrium wage. 2. Draw the specific points of Equilibrium quantities of Car and Rice on Production functions, labor allocation, and PPF based on the equilibrium wage. (10 points) 7.1 What are the equilibrium wages, quantities or Car and Rice, labor allocation for Car and Rice. 8. Based on equilibriums of wage, quantities of Car and Rice, and labor allocation above graph, explain the effects of migration on the economy. Write down the results of migration on the economy based on the 4-dimension graph in problem 7. (Hint: Migration can increase a total available labor (In this case, without migration Labor is 25. Due to migration, available labor will be 30 or 35 . Therefore, total resource to make car and rice will increase). As a result, the economy can use more labor. You have to consider inter-relationships between labor allocation, production, and PPF. (10 points, N? more than 300 words)