Home /
Expert Answers /
Economics /
8-changes-in-taxes-the-following-graph-plots-an-aggregate-demand-curve-using-the-graph-sh-pa888
(Solved): 8. Changes in taxes The following graph plots an aggregate demand curve. Using the graph, sh ...
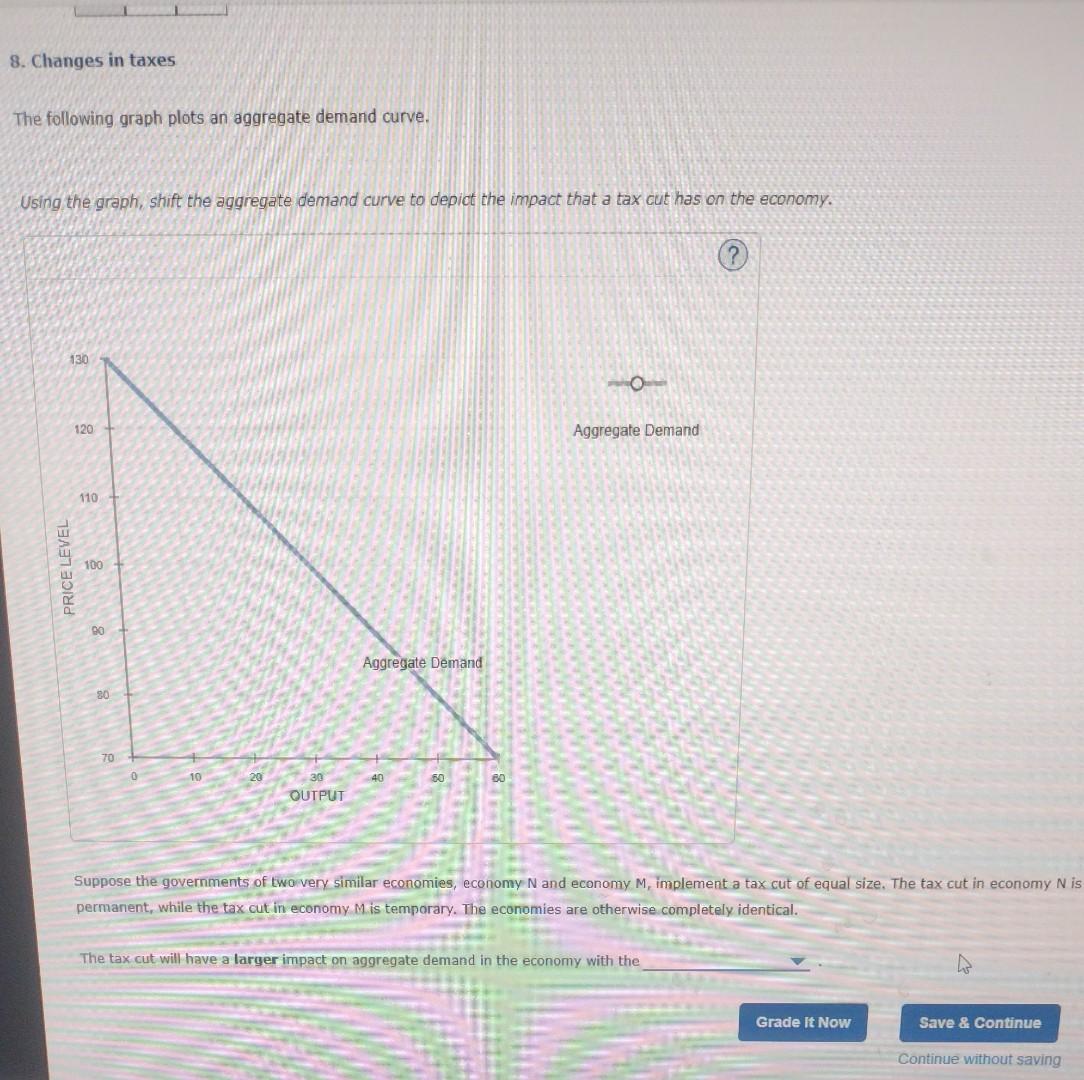
8. Changes in taxes The following graph plots an aggregate demand curve. Using the graph, shift the aggregate demand curve to depict the impact that a tax cut has on the economy. permanent, while the tax cut in economy M is temporary. The economies are otherwise completely identical. The tax cut will have a larger impact on aggregate demand in the economy with the
Expert Answer
ANSWERAggregate DemandAggregate demand refers to the sum of the demand for all finished goods and services within a specified period of time.Explanati