Home /
Expert Answers /
Advanced Physics /
a-graph-showing-electron-transfer-rate-versus-thermodynamic-favorability-for-each-of-the-donoraccep-pa804
(Solved): A graph showing electron transfer rate versus thermodynamic favorability for each of the donoraccep ...
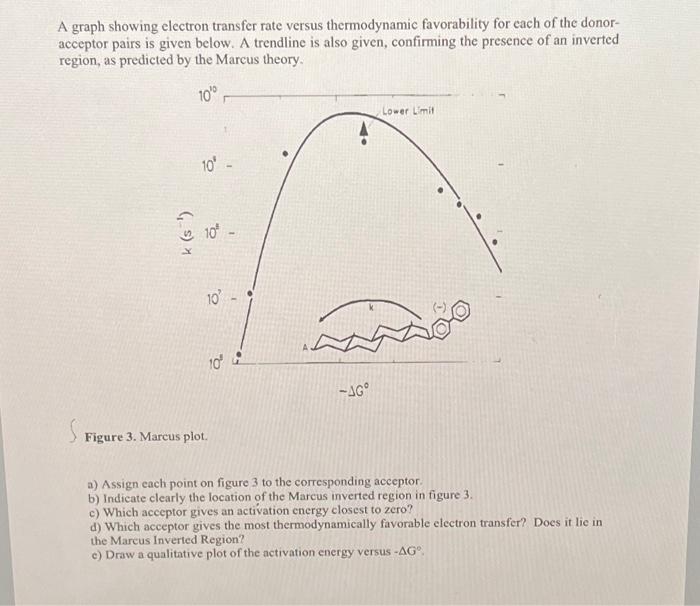
A graph showing electron transfer rate versus thermodynamic favorability for each of the donoracceptor pairs is given below. A trendline is also given, confirming the presence of an inverted region, as predicted by the Marcus theory. Figure 3. Marcus plot. a) Assign each point on figure 3 to the corresponding acceptor. b) Indicate clearly the location of the Marcus inverted region in figure 3. c) Which acceptor gives an activation energy closest to zero? d) Which acceptor gives the most thermodynamically favorable electron transfer? Does it lie in the Marcus Inverted Region? c) Draw a qualitative plot of the netivation energy versus .