Home /
Expert Answers /
Chemistry /
a-make-a-plot-of-absorbance-versus-concentration-for-the-data-set-draw-the-best-straig-pa525
(Solved): a) Make a plot of absorbance versus concentration for the data set. Draw the best straig ...
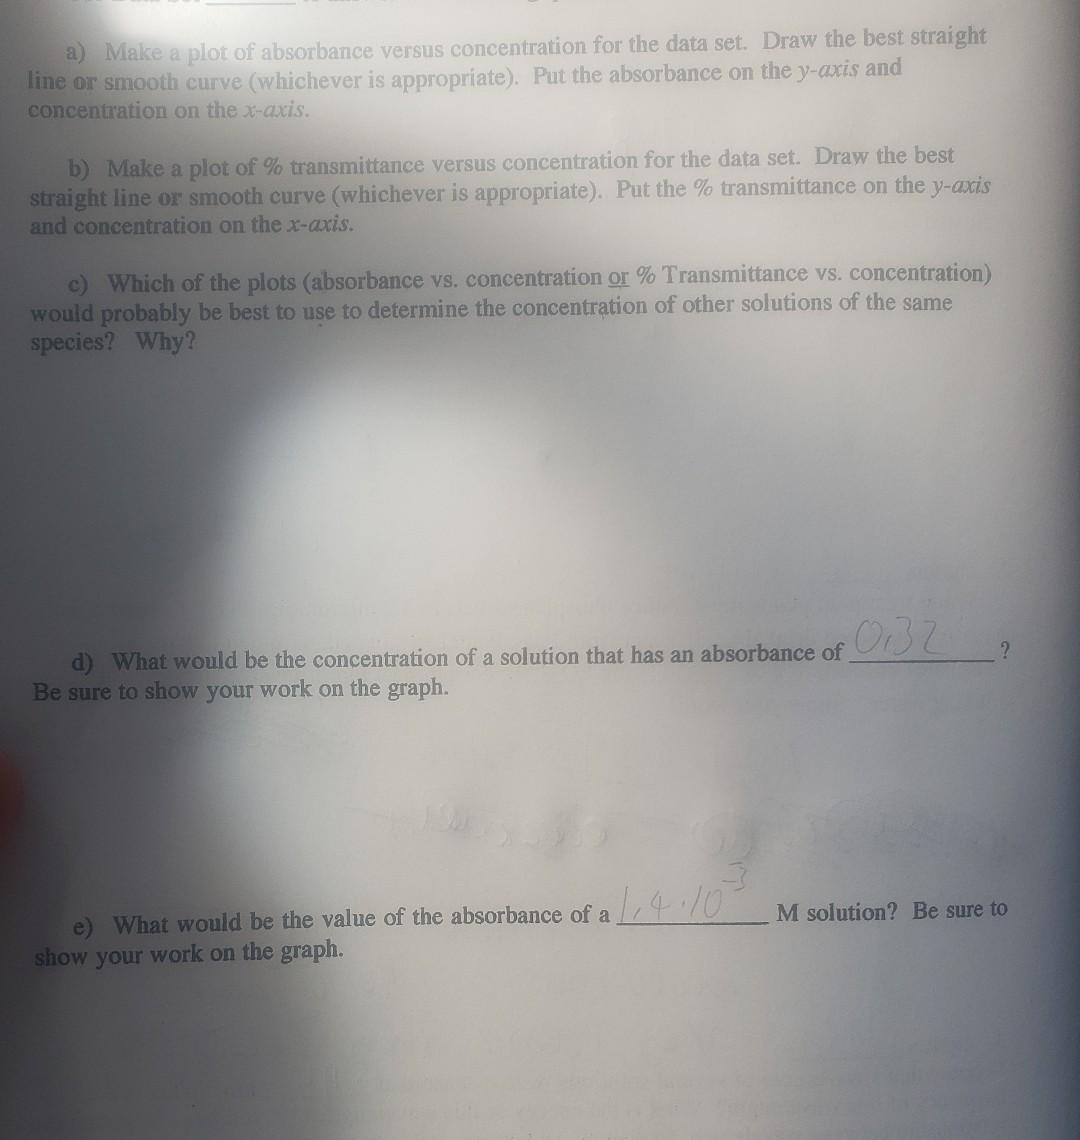
a) Make a plot of absorbance versus concentration for the data set. Draw the best straight line or smooth curve (whichever is appropriate). Put the absorbance on the -axis and concentration on the -axis. b) Make a plot of \% transmittance versus concentration for the data set. Draw the best straight line or smooth curve (whichever is appropriate). Put the \% transmittance on the -axis and concentration on the -axis. c) Which of the plots (absorbance vs, concentration or Transmittance vs. concentration) would probably be best to use to determine the concentration of other solutions of the same species? Why? d) What would be the concentration of a solution that has an absorbance of ? Be sure to show your work on the graph. e) What would be the value of the absorbance of a M solution? Be sure to show your work on the graph.
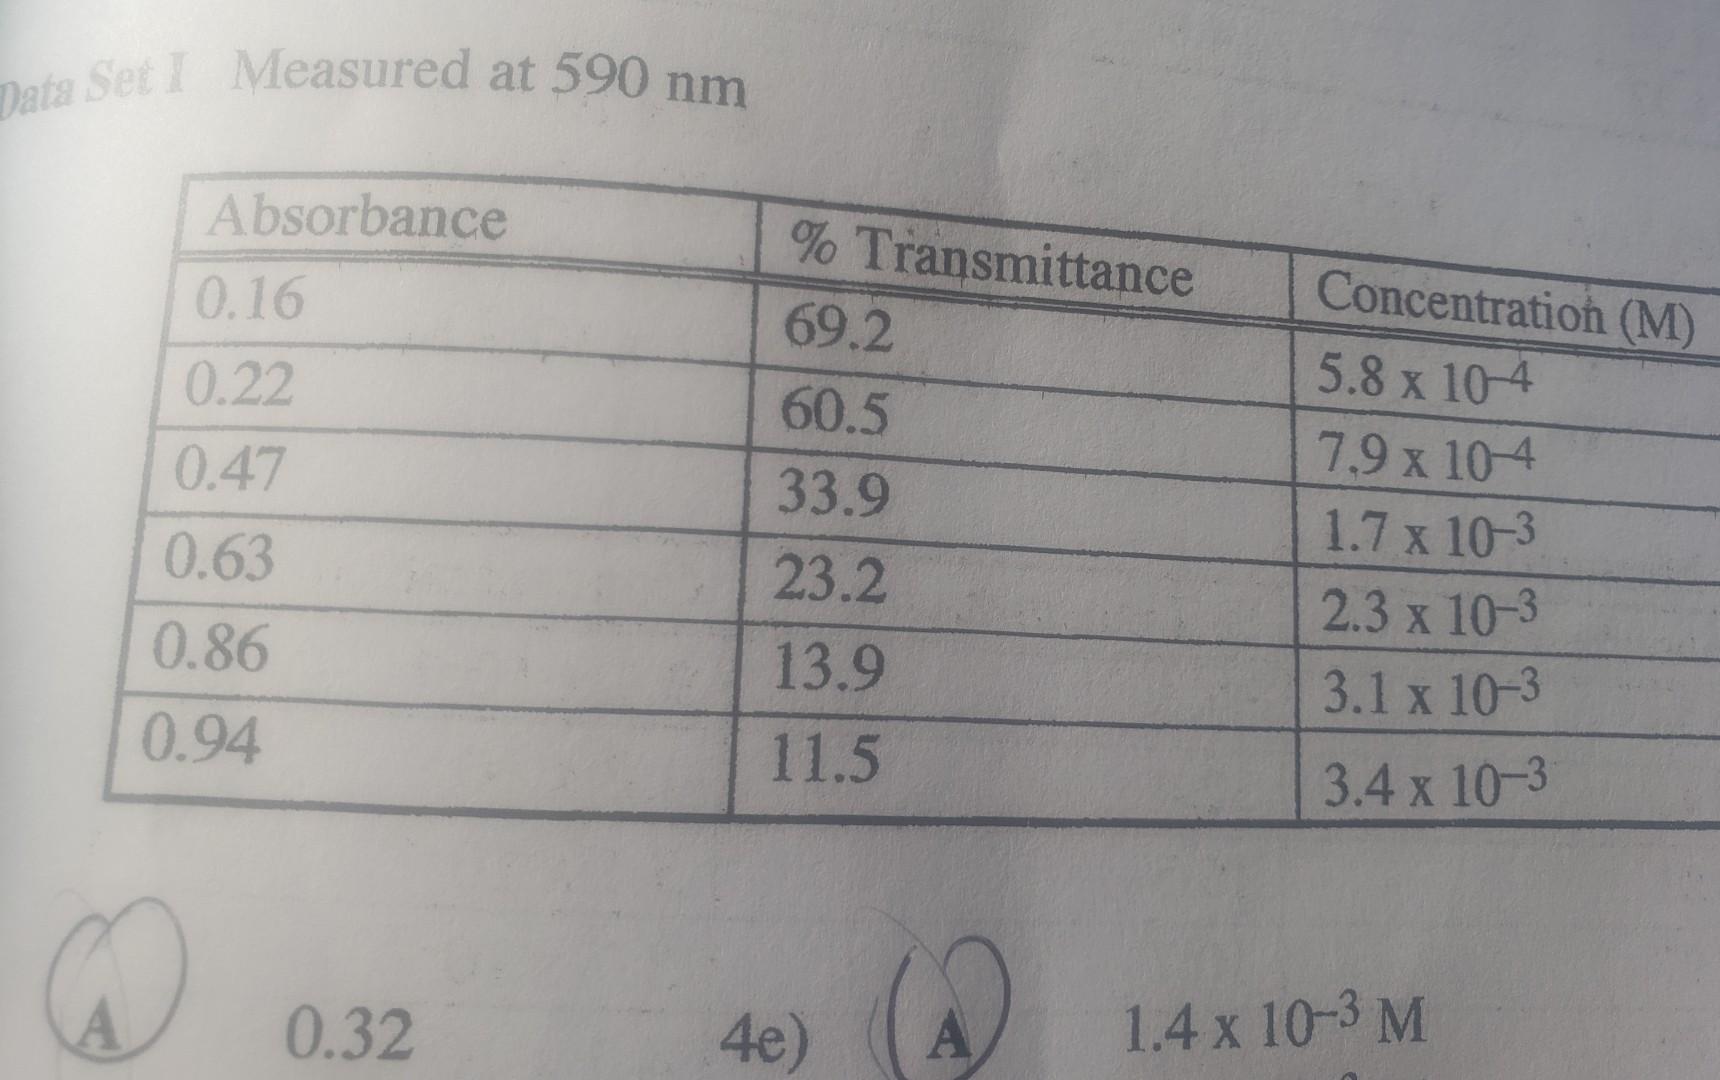
Data Set I Measured at