Home /
Expert Answers /
Calculus /
a-patient-receives-the-same-dose-of-medication-at-regular-time-intervals-the-graph-shows-the-quan-pa808
(Solved): A patient receives the same dose of medication at regular time intervals. The graph shows the quan ...
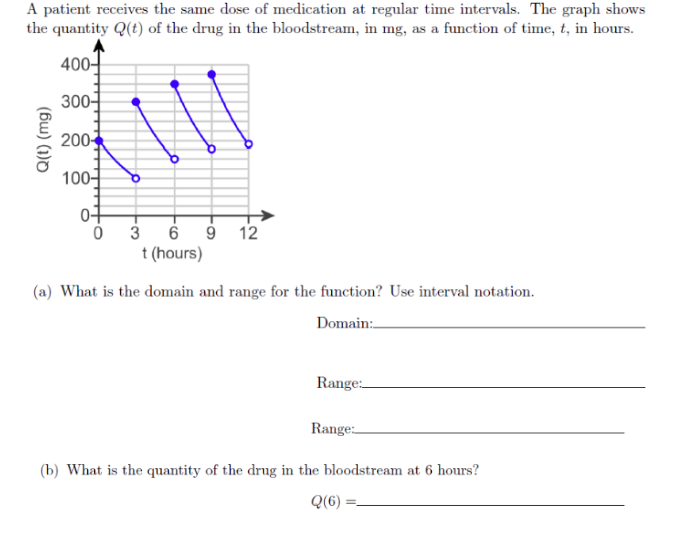
A patient receives the same dose of medication at regular time intervals. The graph shows the quantity \( Q(t) \) of the drug in the bloodstream, in mg, as a function of time, \( t \), in hours. (a) What is the domain and range for the function? Use interval notation.
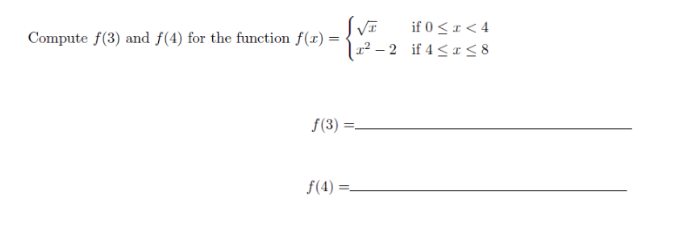
Compute \( f(3) \) and \( f(4) \) for the function \( f(x)=\left\{\begin{array}{ll}\sqrt{x} & \text { if } 0 \leq x<4 \\ x^{2}-2 & \text { if } 4 \leq x \leq 8\end{array}\right. \) \( f( \) \[ f(4)= \]