Home /
Expert Answers /
Economics /
a-plot-this-data-on-a-graph-b-complete-the-table-by-calculating-the-percentage-changes-from-the-pa389
(Solved): a. Plot this data on a graph. b. Complete the table by calculating the percentage changes from the ...
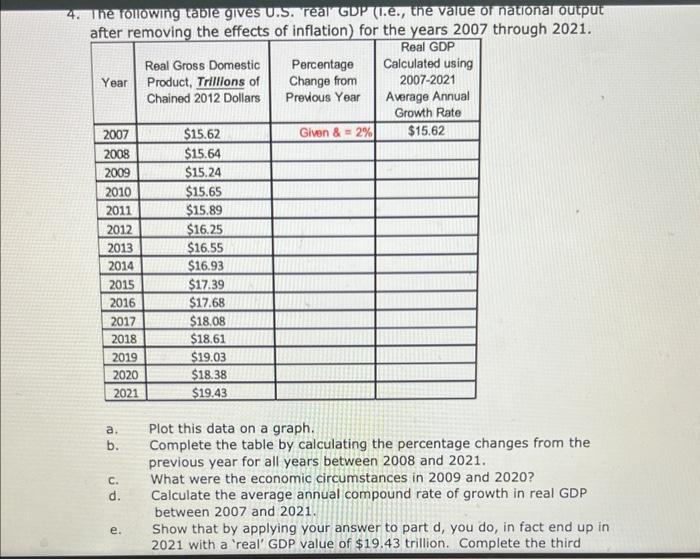
a. Plot this data on a graph. b. Complete the table by calculating the percentage changes from the previous year for all years between 2008 and \( 2021 . \) c. What were the economic circumstances in 2009 and 2020 ? d. Calculate the average annual compound rate of growth in real GDP between 2007 and 2021 . e. Show that by applying your answer to part \( d \), you do, in fact end up in 2021 with a 'real' GDP value of \( \$ 19.43 \) trillion. Complete the third