Home /
Expert Answers /
Statistics and Probability /
a-student-took-a-random-sample-of-147-sac-students-below-are-graphs-comparing-the-ages-of-3-differe-pa429
(Solved): A student took a random sample of 147 SAC students. Below are graphs comparing the ages of 3 differe ...
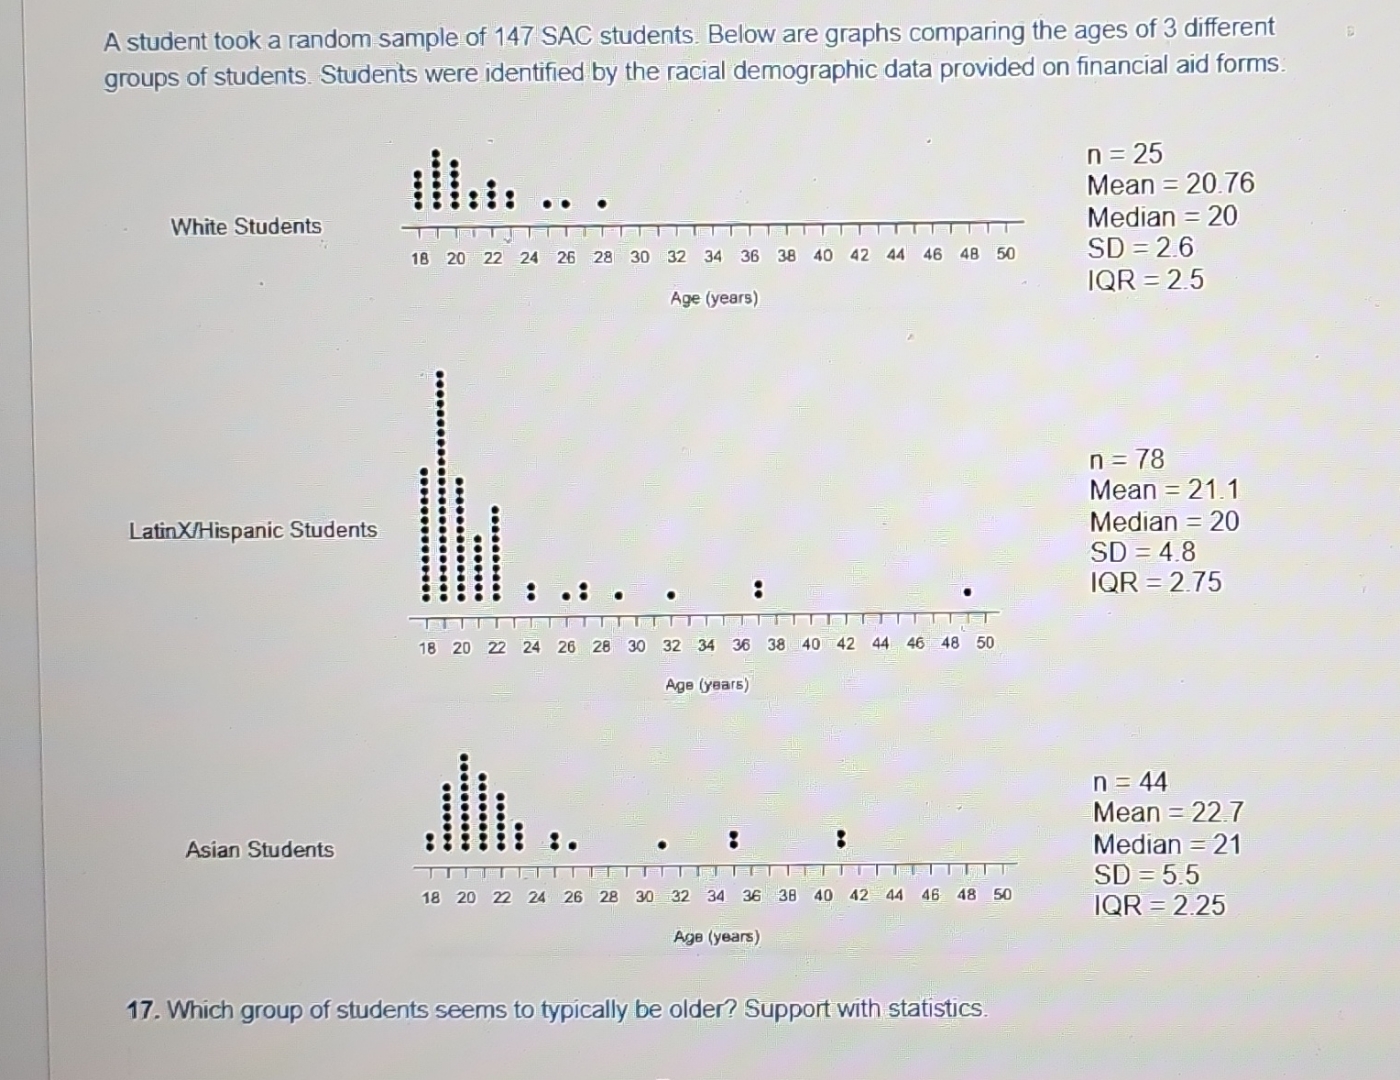
A student took a random sample of 147 SAC students. Below are graphs comparing the ages of 3 different groups of students. Students were identified by the racial demographic data provided on financial aid forms.
n=25
 Mean =20.76
 Median =20
SD=2.6
 IQR =2.5
n=78
 Mean =21.1
 Median =20
SD=4.8
 IQR =2.75
n=44
 Mean =22.7
 Median =21
SD=5.5
 IQR =2.25
Which group of students seems to typically be older? Support with statistics.