Home /
Expert Answers /
Statistics and Probability /
a-study-looked-at-outliers-arising-from-a-plot-of-average-wind-speed-by-month-in-the-hopkins-fores-pa711
(Solved): A study looked at outliers arising from a plot of average wind speed by month in the Hopkins Fores ...
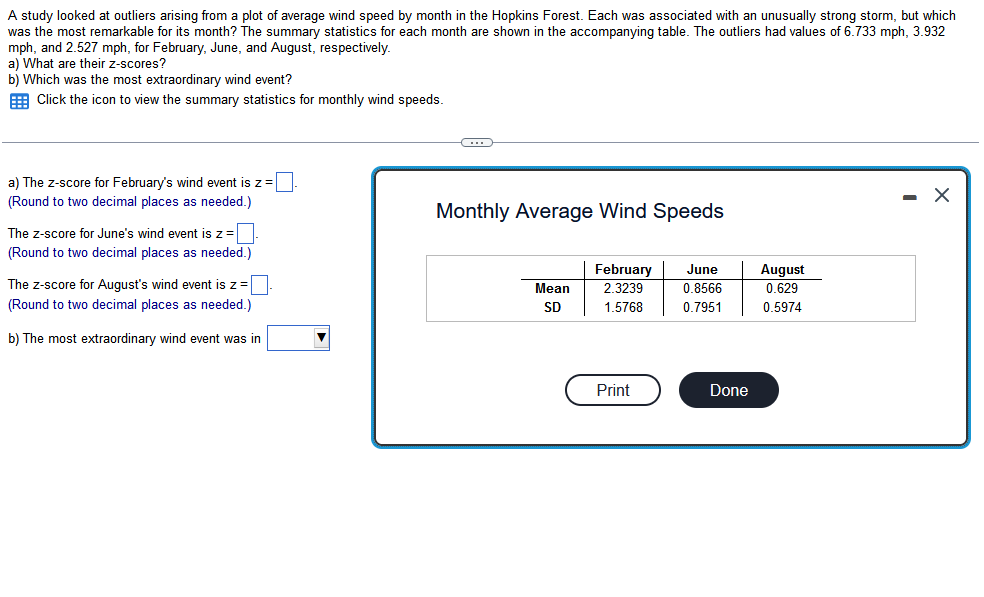
A study looked at outliers arising from a plot of average wind speed by month in the Hopkins Forest. Each was associated with an unusually strong storm, but which was the most remarkable for its month? The summary statistics for each month are shown in the accompanying table. The outliers had values of \( 6.733 \) mph, \( 3.932 \) \( \mathrm{mph} \), and \( 2.527 \mathrm{mph} \), for February, June, and August, respectively. a) What are their z-scores? b) Which was the most extraordinary wind event? Click the icon to view the summary statistics for monthly wind speeds. a) The z-score for February's wind event is \( z= \) (Round to two decimal places as needed.) Monthly Average Wind Speeds The \( z \)-score for June's wind event is \( z= \) (Round to two decimal places as needed.) The \( z \)-score for August's wind event is \( z= \) (Round to two decimal places as needed.) b) The most extraordinary wind event was in
Expert Answer
The formula for z score is z=x?meansd