Home /
Expert Answers /
Advanced Physics /
a-the-diagram-below-is-a-graph-of-potential-energy-vs-interatomic-separation-for-a-particular-dia-pa456
(Solved): (a) The diagram below is a graph of potential energy vs. interatomic separation for a particular dia ...
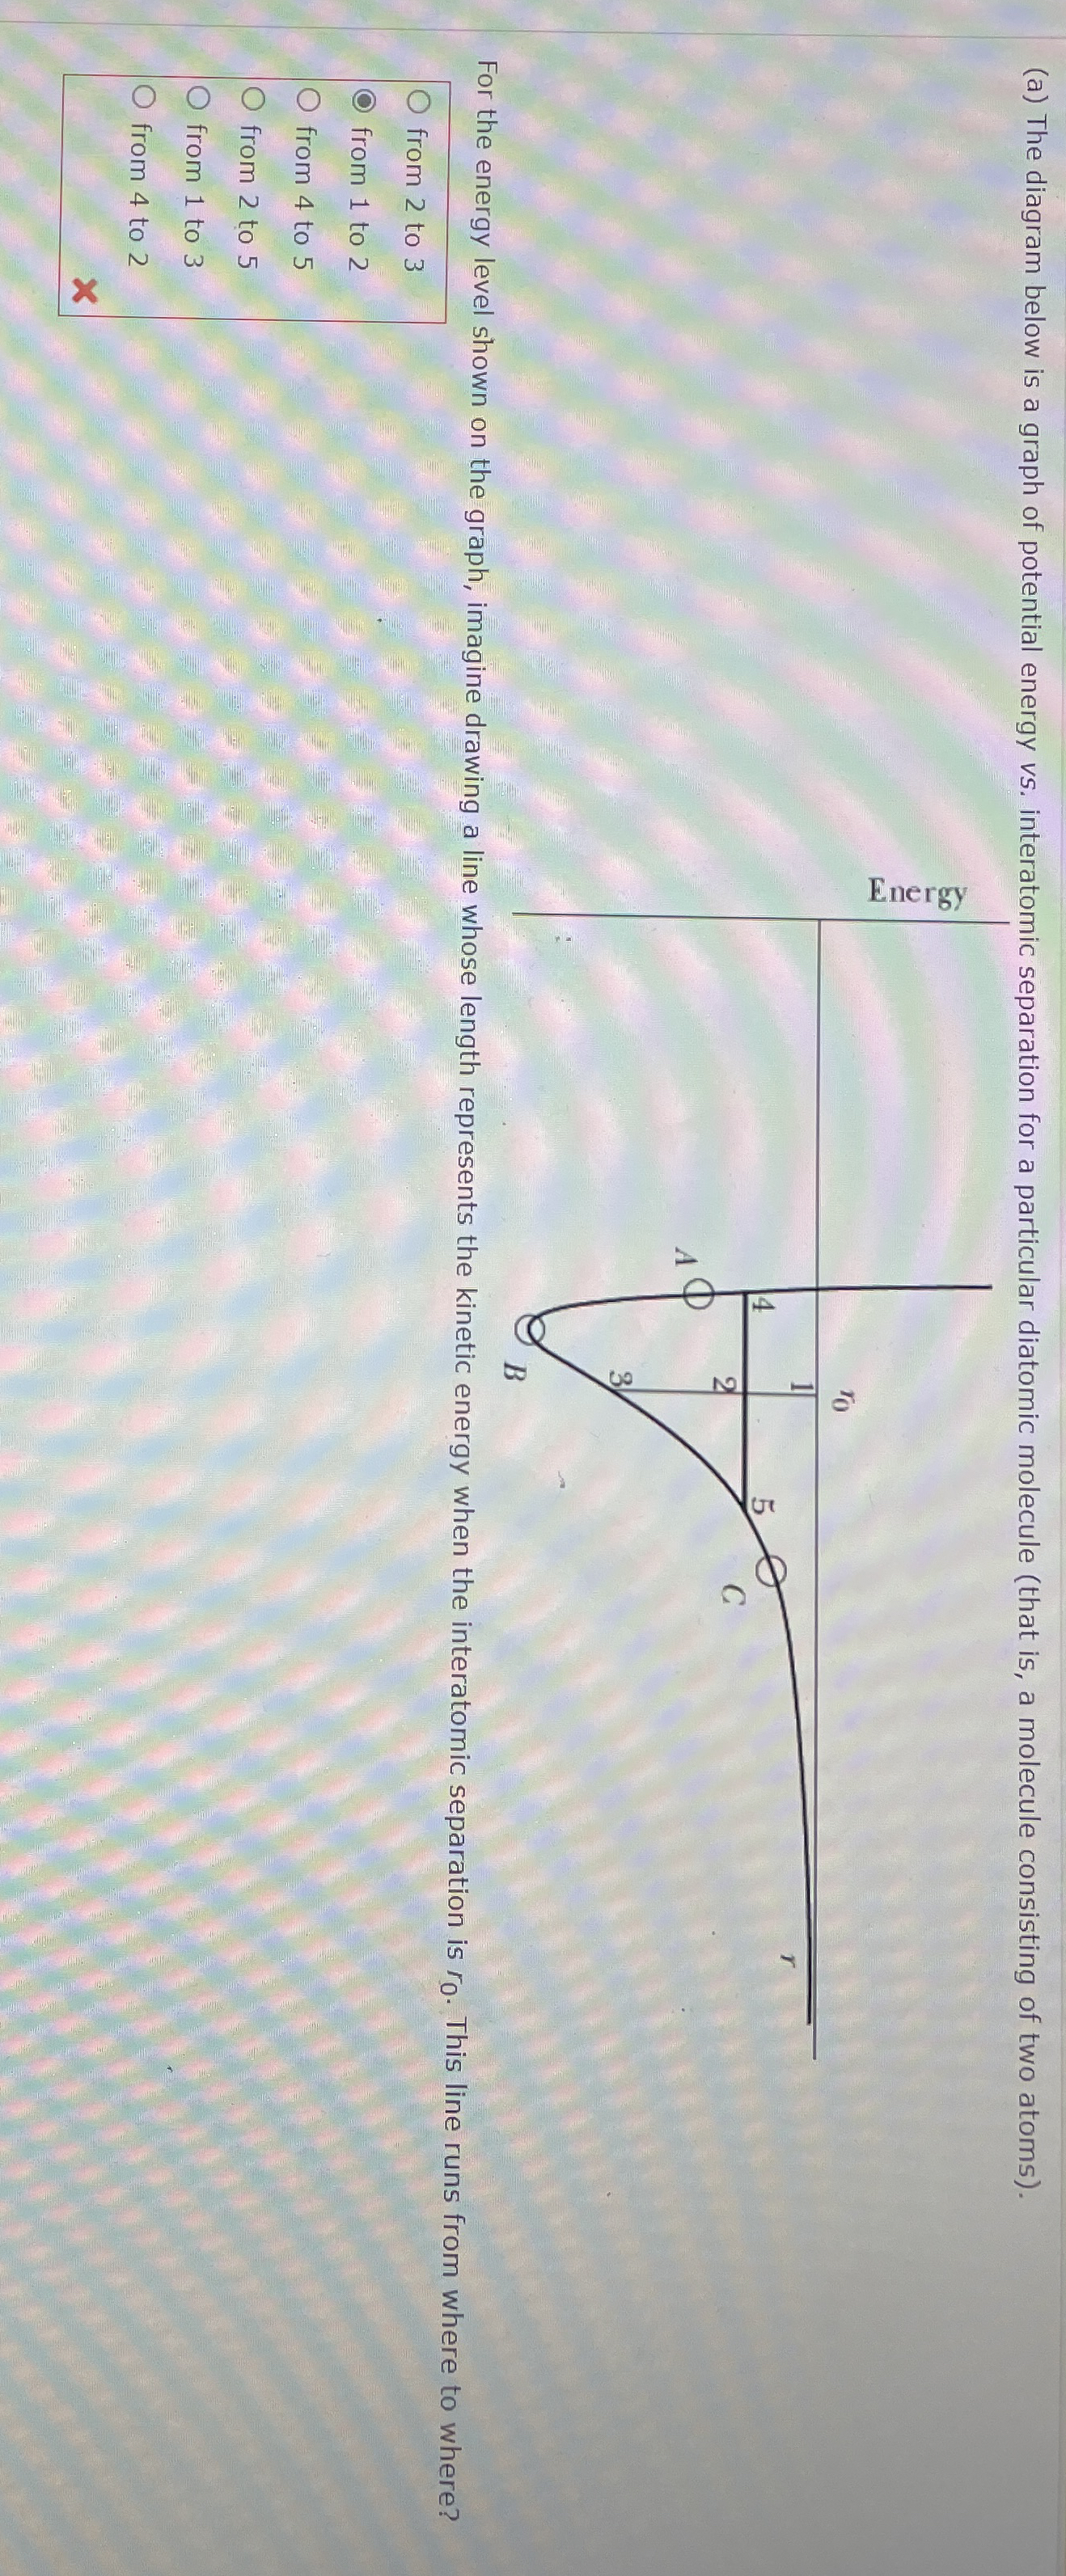
(a) The diagram below is a graph of potential energy vs. interatomic separation for a particular diatomic molecule (that is, a molecule consisting of two atoms). For the energy level shown on the graph, imagine drawing a line whose length represents the kinetic energy when the interatomic separation is
r_(0). This line runs from where to where?
?from 2 to 3 from 1 to 2 from 4 to 5 from 2 to 5 from 1 to 3 from 4 to 2