Home /
Expert Answers /
Statistics and Probability /
an-article-in-technometrics-by-s-c-narula-and-j-f-wellington-34-prediction-linear-regression-pa119
(Solved): An article in Technometrics by S. C. Narula and J. F. Wellington ("Prediction, Linear Regression, ...
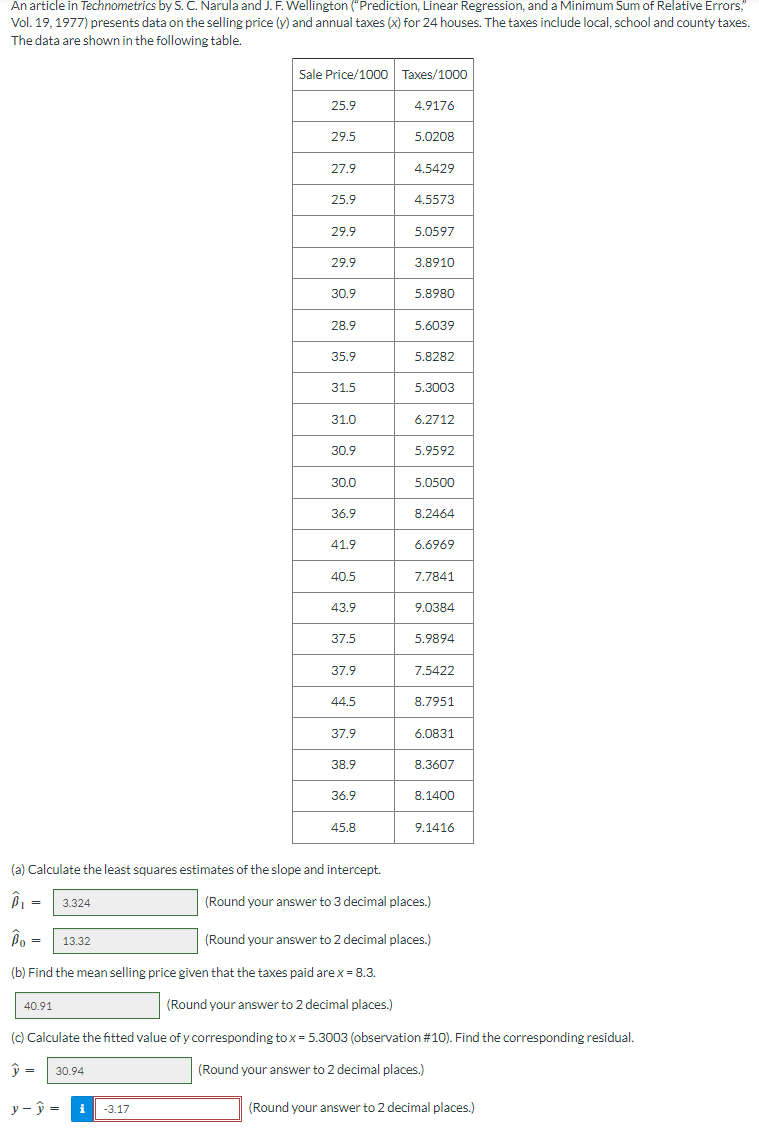
An article in Technometrics by S. C. Narula and J. F. Wellington ("Prediction, Linear Regression, and a Minimum Sum of Relative Errors," Vol. 19, 1977) presents data on the selling price \( (y) \) and annual taxes \( (x) \) for 24 houses. The taxes include local, school and county taxes. The data are shown in the following table. \begin{tabular}{|c|c|} \hline Sale Price/1000 & Taxes \( / 1000 \) \\ \hline \( 25.9 \) & \( 4.9176 \) \\ \hline \( 29.5 \) & \( 5.0208 \) \\ \hline \( 27.9 \) & \( 4.5429 \) \\ \hline \( 25.9 \) & \( 4.5573 \) \\ \hline \( 29.9 \) & \( 5.0597 \) \\ \hline \( 29.9 \) & \( 3.8910 \) \\ \hline \( 30.9 \) & \( 5.8980 \) \\ \hline \( 28.9 \) & \( 5.6039 \) \\ \hline \( 35.9 \) & \( 5.8282 \) \\ \hline \( 31.5 \) & \( 5.3003 \) \\ \hline \( 36.9 \) & \( 8.1400 \) \\ \hline \( 45.8 \) & \( 9.1416 \) \\ \hline \( 31.0 \) & \( 6.2712 \) \\ \hline \( 30.9 \) & \( 5.9592 \) \\ \hline \( 38.9 \) & \( 8.3607 \) \\ \hline \( 30.0 \) & \( 5.0500 \) \\ \hline \( 36.9 \) & \( 8.2464 \) \\ \hline \( 41.9 \) & \( 6.6969 \) \\ \hline \( 40.5 \) & \( 7.7841 \) \\ \hline \( 43.9 \) & \( 9.0384 \) \\ \hline \( 37.9 \) & \( 5.9894 \) \\ \hline \end{tabular} (a) Calculate the least squares estimates of the slope and intercept. \[ \begin{array}{ll} \hat{\beta}_{1}= & \text { (Round your answer to } 3 \text { decimal places.) } \\ \widehat{\beta}_{0}= & \text { (Round your answer to } 2 \text { decimal places.) } \end{array} \] (b) Find the mean selling price given that the taxes paid are \( x=8.3 \). (Round your answer to 2 decimal places.) (c) Calculate the fitted value of \( y \) corresponding to \( x=5.3003 \) (observation \#10). Find the corresponding residual. \[ \begin{array}{ll} \hat{y}= & \text { (Round your answer to } 2 \text { decimal places.) } \\ y-\hat{y}=\mid & \text { (Round your answer to } 2 \text { decimal places.) } \end{array} \]
Expert Answer
create vectors with given data in R and then running regression using function lm(y~x) below is R code: x <- c(4.9176,5.0208,4.5429,4.5573,5.0597,3.89