(Solved): As a newly hired compensation analyst, youve been asked by the Director of Compensation to assist ...
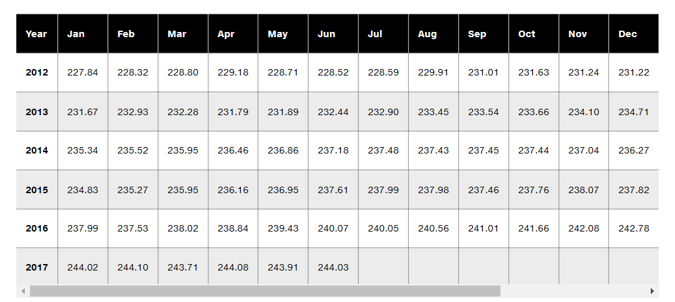
As a newly hired compensation analyst, you’ve been asked by the Director of Compensation to assist with the preparation of next year’s compensation plan for accounting jobs. The period for the compensation plan is January 1–December 31, 2018. Your assignment is to update salary survey data using the CPI-U to estimate new salary information. Also, assume that it is July 1, 2017, and you have been asked to submit your analysis within the next two days. The salary survey data were current through the end of 2016, and the initial average salary reported for accountant jobs in the survey was $50,000. The salary data will be 12 and 24 months old at the pay plan’s implementation (on January 1, 2018) and end (December 31, 2018), respectively. You have been provided with national CPI-U data, which were obtained from the U.S. Bureau of Labor Statistics website. Questions: 7-10. By what percent did the cost of goods and services change between December 2016 and June 2017? 7-11. (a) By what percent might you expect the average cost of goods and services to change over the second 6-month period of 2017? Hint: First, calculate the percentage cost change for the period July through December for each of the previous years: 2012 through 2016. Second, take the average of these five figures. This calculation gives us the average percent cost change. Estimates based on multiple years gives us a more stable picture of percent cost changes. (b) What is the estimated average salary for December 31, 2017? Hint: [(initial average salary × average percent cost change) + initial average salary]. 7-12. (a) By what percent might you expect the average cost of goods and services to change between January 1, 2018 and December 31, 2018? Hint: First, calculate the percent cost change for the period January through December for each of the previous years: 2012 through 2016. Second, take the average of these five figures to calculate the average percent cost change. (b) What is the estimated average salary for December 31, 2018? Hint: [(December 2017 average salary × average percentage cost change) + December 2017 average salary]. \begin{tabular}{|c|c|c|c|c|c|c|c|c|c|c|c|c|} \hline Year & Jan & Feb & Mar & Apr & May & Jun & Jul & Aug & Sep & Oct & Nov & Dec \\ \hline 2012 & 227.84 & 228.32 & 228.80 & 229.18 & 228.71 & 228.52 & 228.59 & 229.91 & 231.01 & 231.63 & 231.24 & 231.22 \\ \hline 2013 & 231.67 & 232.93 & 232.28 & 231.79 & 231.89 & 232.44 & 232.90 & 233.45 & 233.54 & 233.66 & 234.10 & 234.71 \\ \hline 2014 & 235.34 & 235.52 & 235.95 & 236.46 & 236.86 & 237.18 & 237.48 & 237.43 & 237.45 & 237.44 & 237.04 & 236.27 \\ \hline 2015 & 234.83 & 235.27 & 235.95 & 236.16 & 236.95 & 237.61 & 237.99 & 237.98 & 237.46 & 237.76 & 238.07 & 237.82 \\ \hline 2016 & 237.99 & 237.53 & 238.02 & 238.84 & 239.43 & 240.07 & 240.05 & 240.56 & 241.01 & 241.66 & 242.08 & 242.78 \\ \hline 2017 & 244.02 & 244.10 & 243.71 & 244.08 & 243.91 & 244.03 & & & & & & \\ \hline 1 & & & & & & & & & & & & \\ \hline \end{tabular}