Home /
Expert Answers /
Economics /
b-graph-the-demand-for-wheat-and-the-supply-of-wheat-be-sure-to-locate-the-equilibrium-price-and-pa348
(Solved): b. Graph the demand for wheat and the supply of wheat. Be sure to locate the equilibrium price and ...
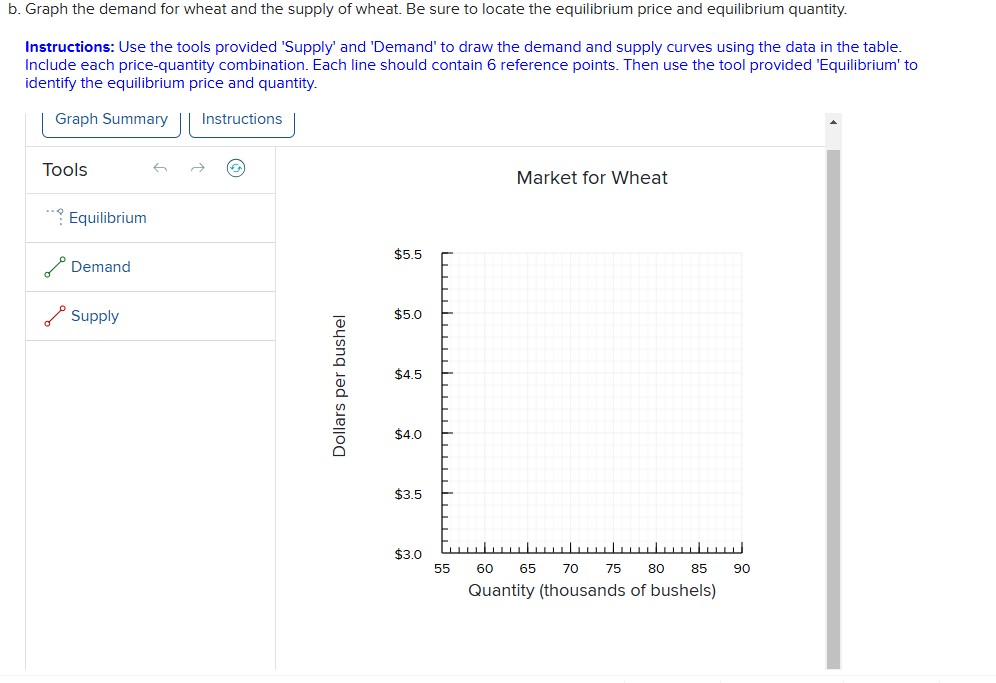
b. Graph the demand for wheat and the supply of wheat. Be sure to locate the equilibrium price and equilibrium quantity. Instructions: Use the tools provided 'Supply' and 'Demand' to draw the demand and supply curves using the data in the table. Include each price-quantity combination. Each line should contain 6 reference points. Then use the tool provided 'Equilibrium' to identify the equilibrium price and quantity. Graph Summary Tools Market for Wheat ? Equilibrium \( \int^{\circ} \) Demand \( \int \) Supply