Home /
Expert Answers /
Economics /
because-different-cities-are-located-in-different-climates-the-relationship-between-hours-of-sunli-pa336
(Solved): Because different cities are located in different climates, the relationship between hours of sunli ...
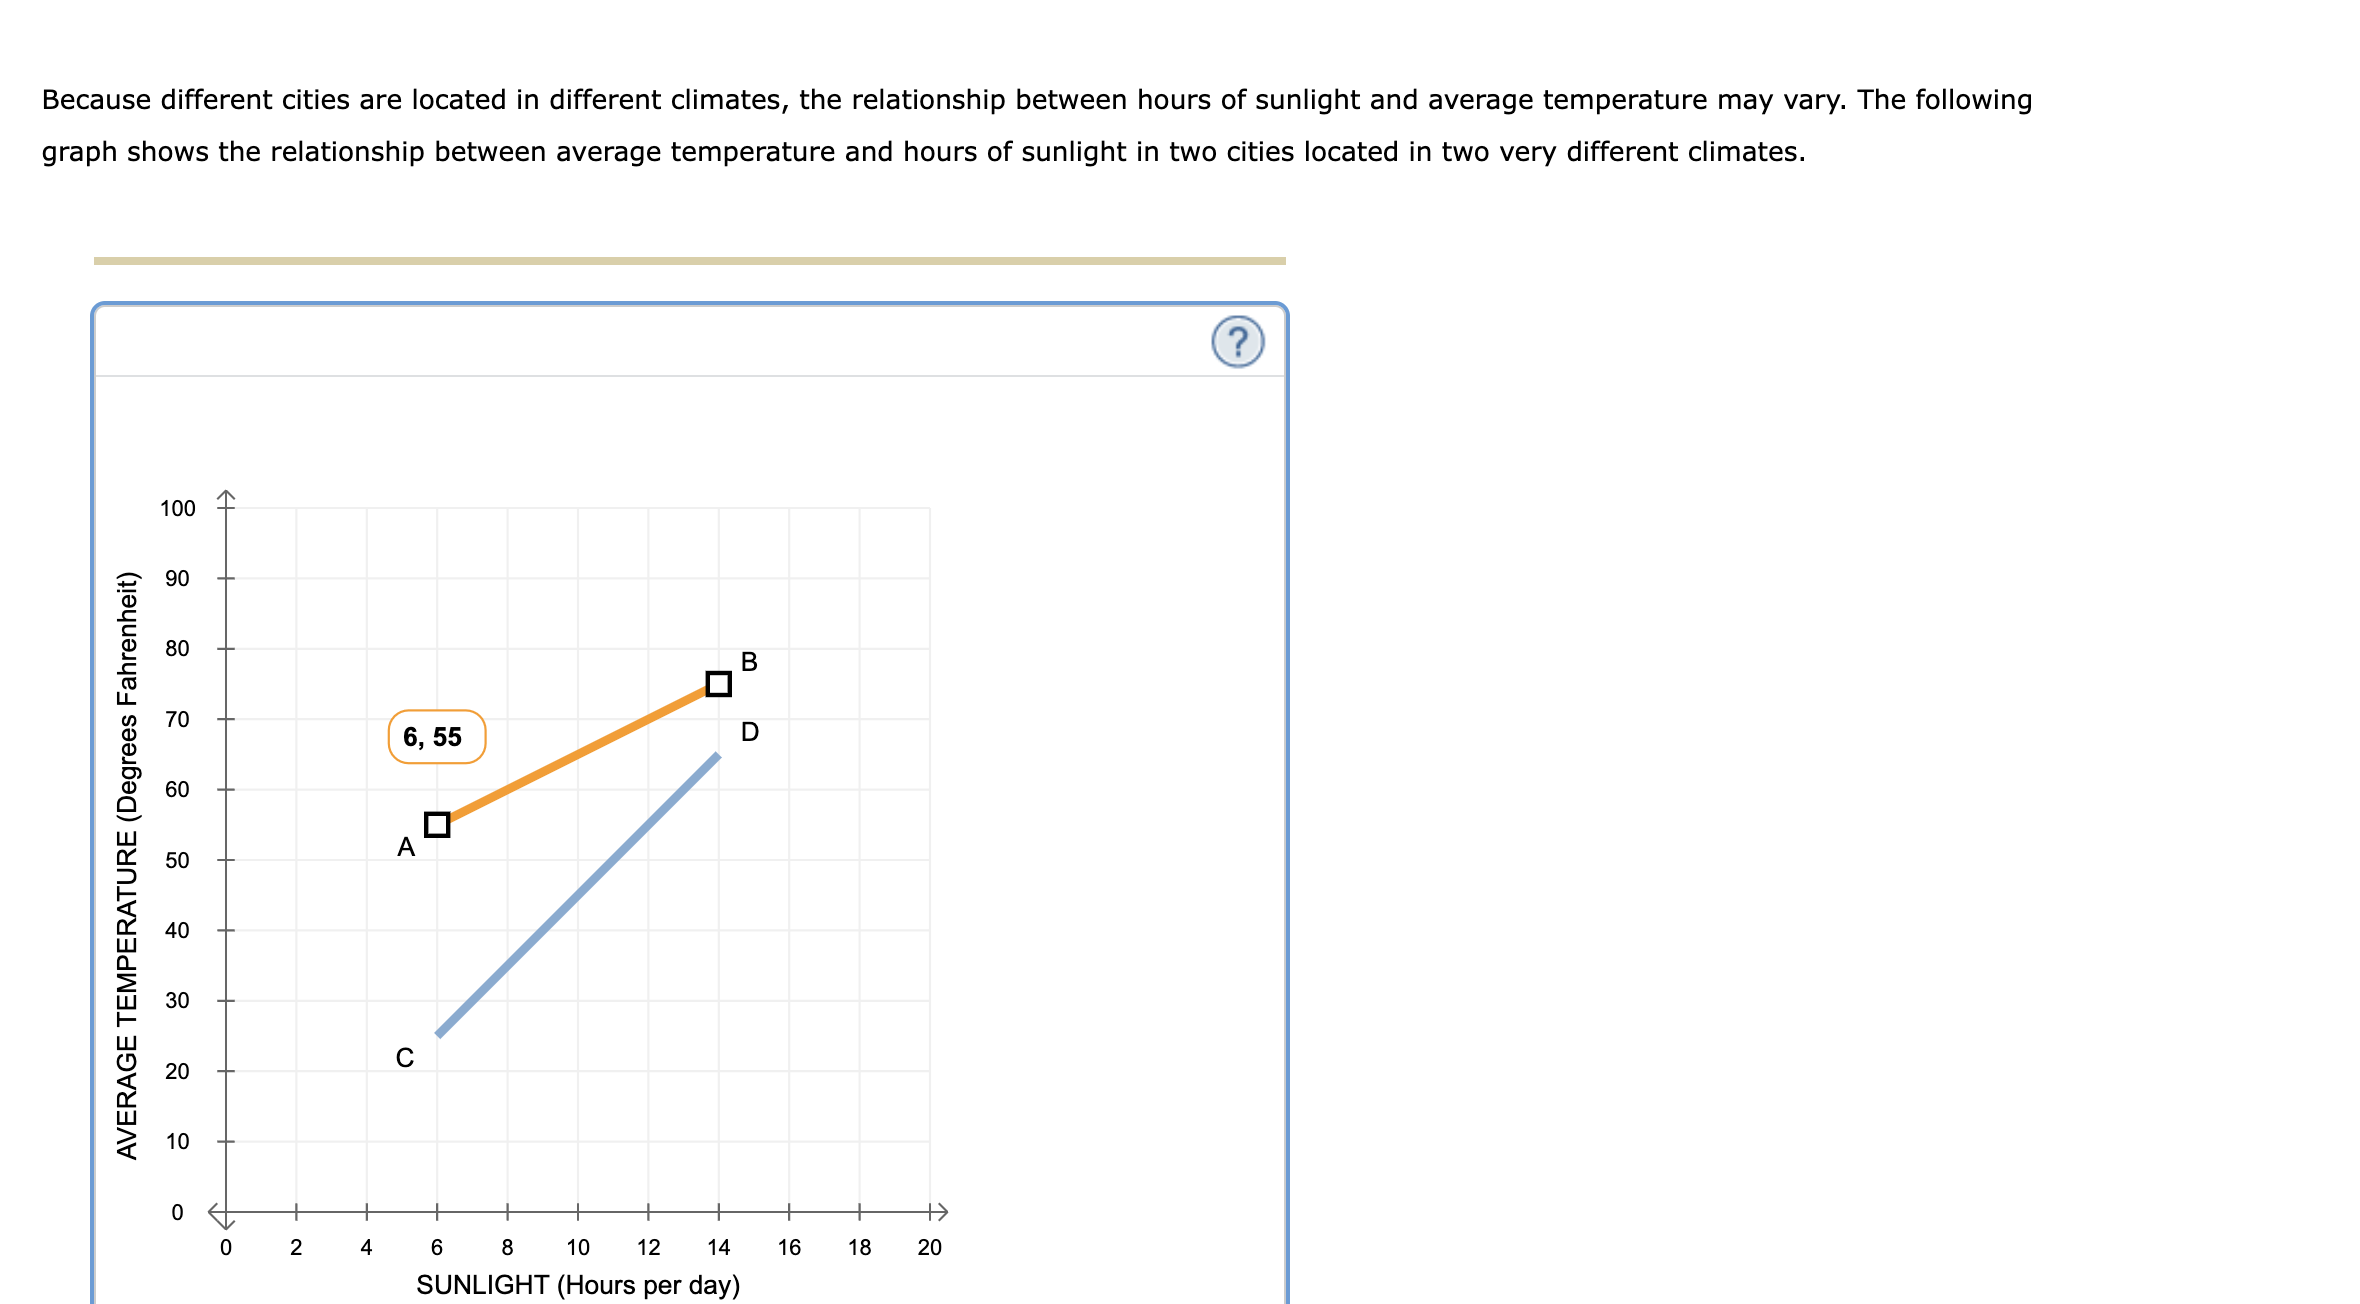
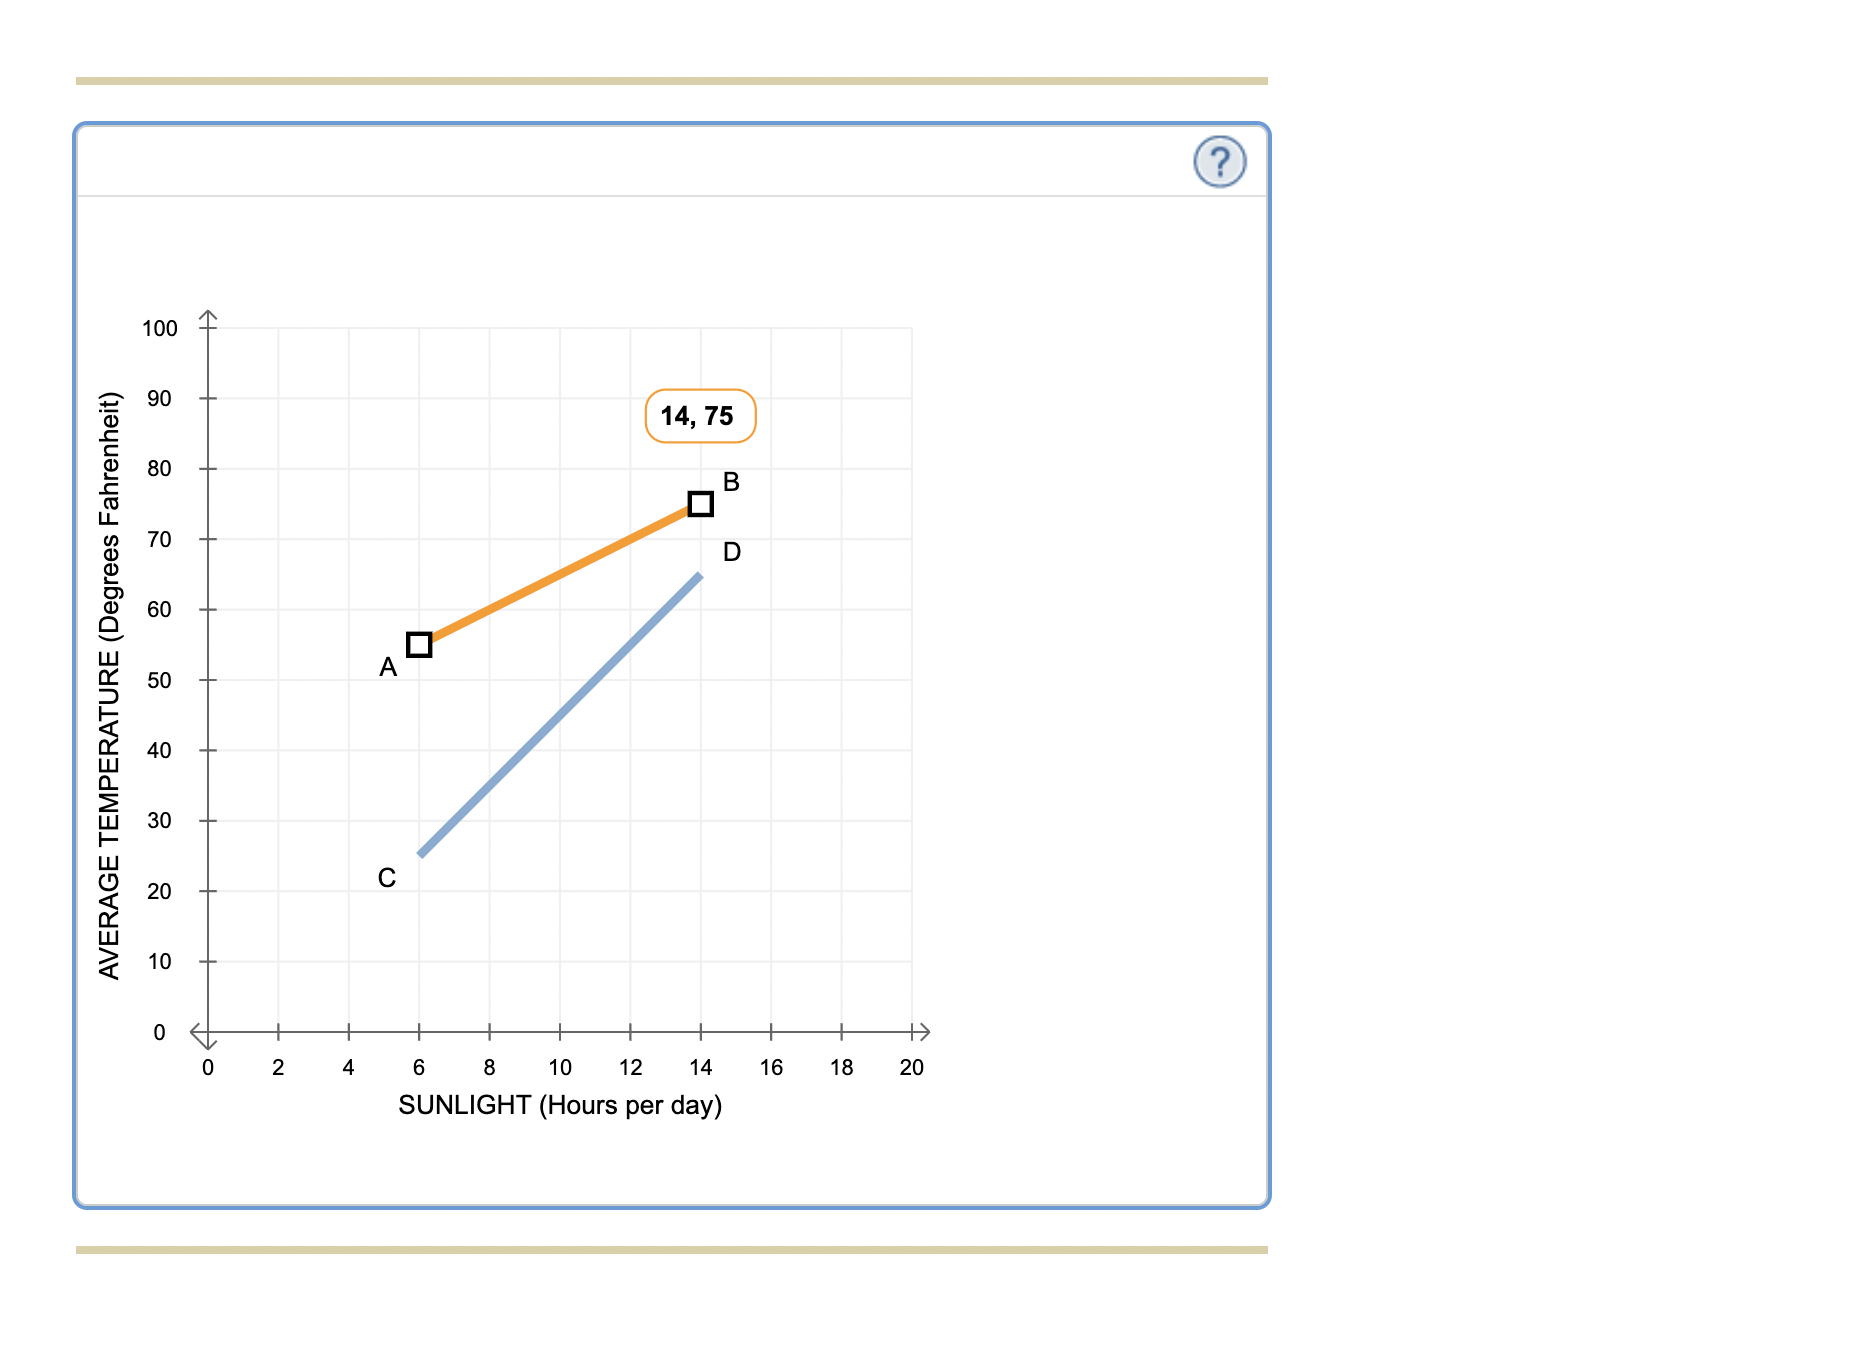
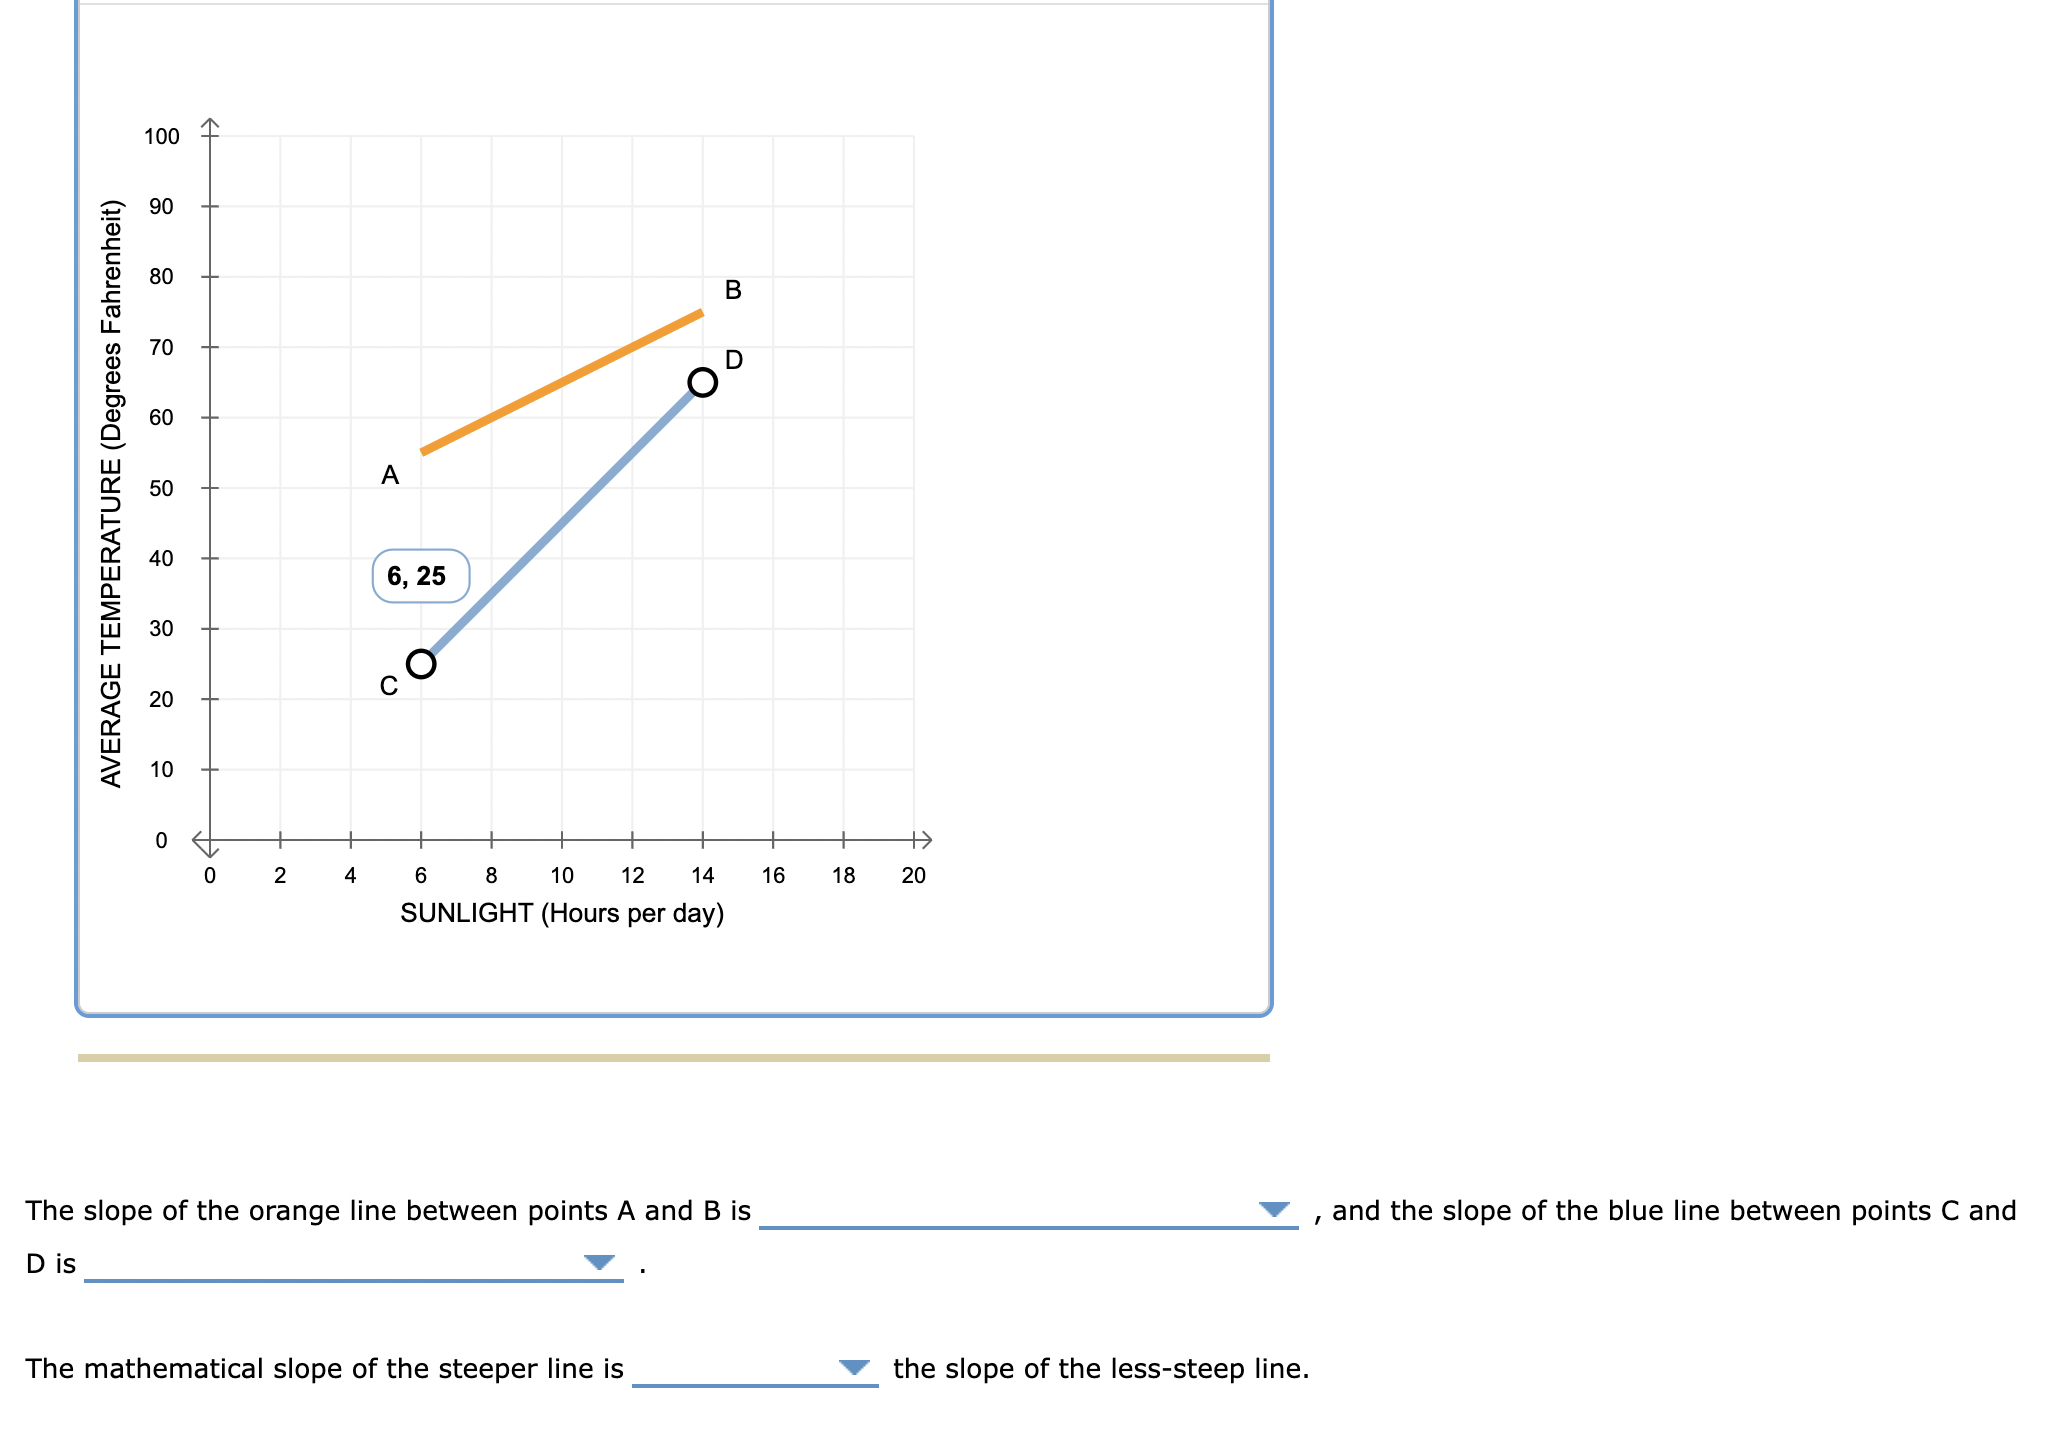
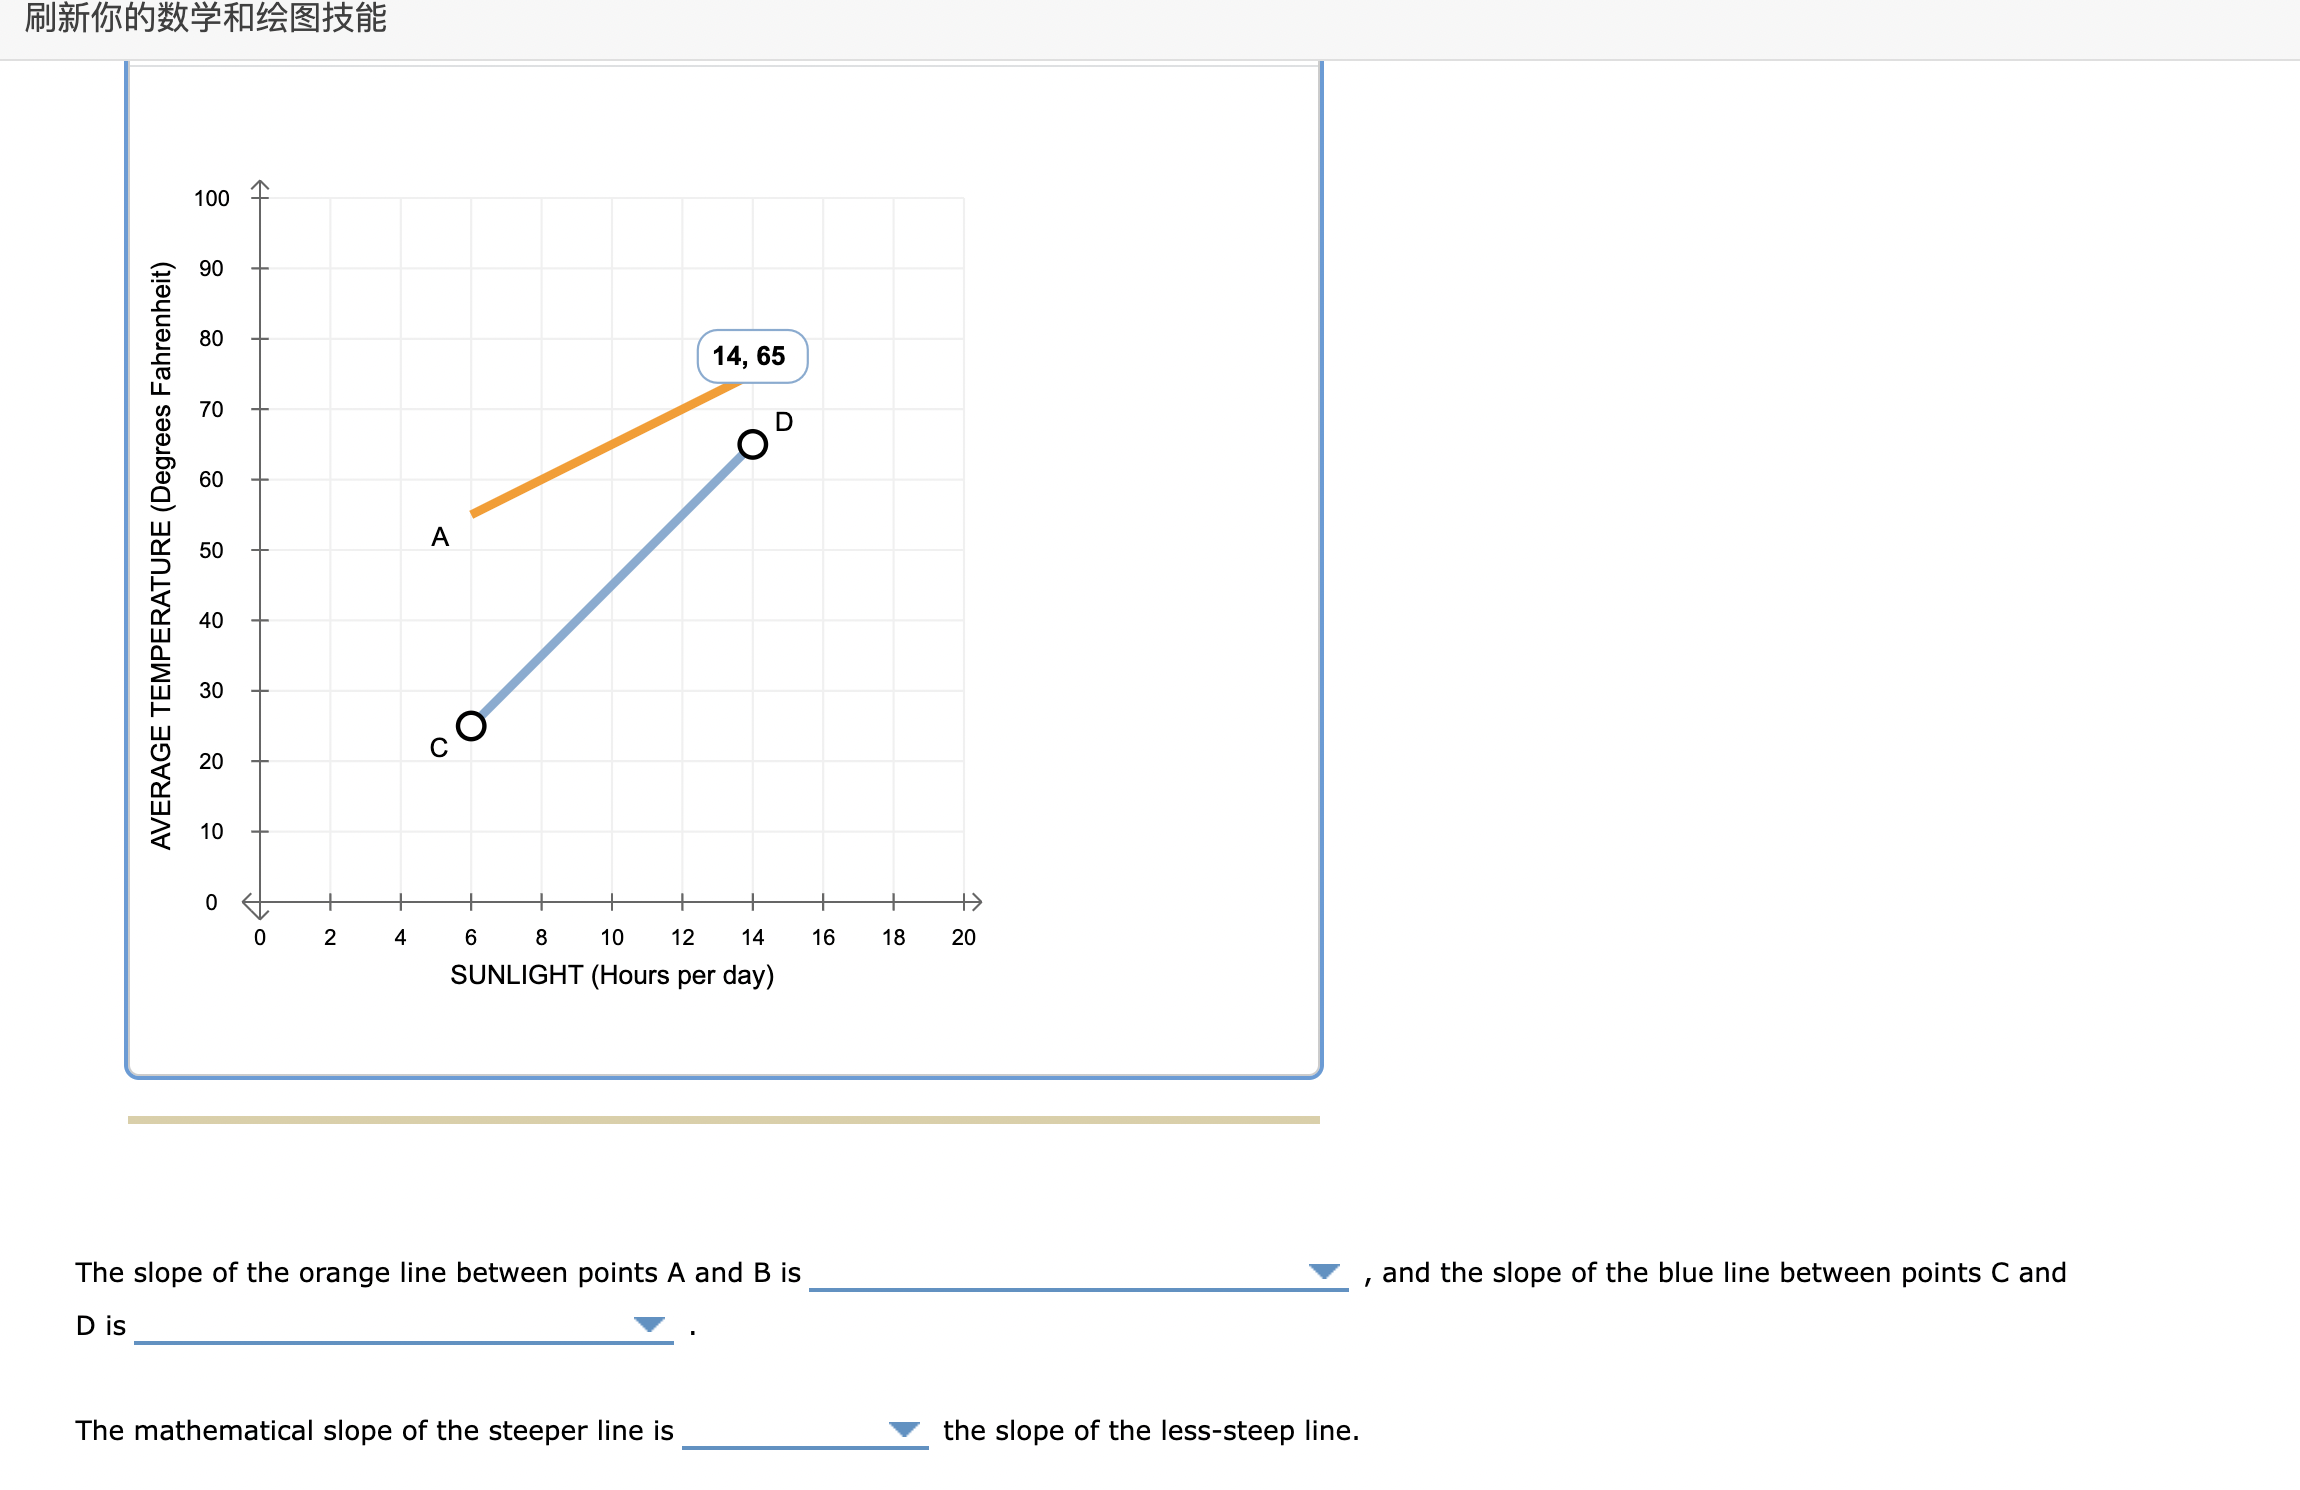
Because different cities are located in different climates, the relationship between hours of sunlight and average temperature may vary. The following graph shows the relationship between average temperature and hours of sunlight in two cities located in two very different climates. The slope of the orange line between points \( A \) and \( B \) is \( D \) is ??????????? The slope of the orange line between points \( A \) and \( B \) is ?and the slope of the blue line between points \( C \) and \( D \) is