Home /
Expert Answers /
Advanced Math /
calculate-the-test-statistic-the-pie-chart-shows-the-diatribution-of-the-opinons-of-parents-on-whet-pa791
(Solved): calculate the test statistic The pie chart shows the diatribution of the opinons of parents on whet ...
calculate the test statistic
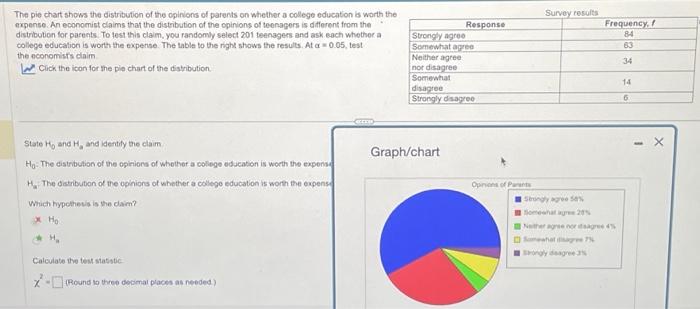
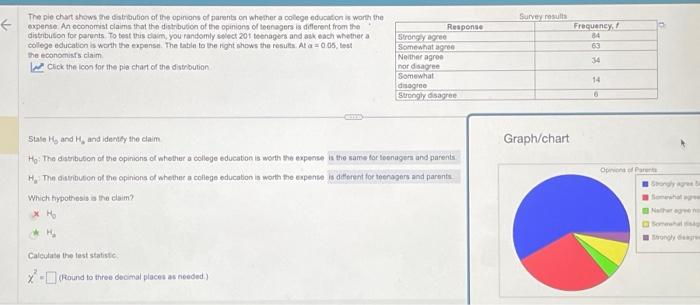
The pie chart shows the diatribution of the opinons of parents on whether a collegu education is worth the expense. An economist claims that the distribution of the opinions of teenagers is diflerent from the distribution for parunts. To teat this claim, you randomly solect 201 teonagors and ask each whether a college education la worth the expense. The tabla to the right shows the resula. Al , lest the economisfs ciaim. Click the icon for the pie chart of the divtribution 5tale and and identhy the elaim Graph/chart H.- The ditribution of the opinions of whether a college education is worth the expecse H. The datribulion of the opinions of whether a college education is worth the expense Which frypothesis is the claim? 16 Hs Calculase the test statiste (Round to three G6cinal places as needed.)
The pie chart shows the distritution of the cpinions of parents on whether a college education is worth the expense. An economist claims that the distribution of the opinions of teenagers is different from the distribution for parents. To test this claim, you randomly select 201 teenagers and ask each whether a college education is worth the experse. The table to the right shows the results. At , test the economists daim. Click the icon for the pie chart of the distribution. State and and identify the claim The distribution of the optrione of whether a coliege edscasion is worth the expense The diatribution of the opinions of whether a college education is worth the expense Which hypothecis is the darm? Calculate ito ten statotic (Round is three decimal places as needed) Graph/chart Peanta Hor Ne: I.