Home /
Expert Answers /
Statistics and Probability /
can-you-explain-the-result-of-each-graph-residual-vs-fitted-normal-q-q-scale-location-and-residua-pa895
(Solved): Can you explain the result of each graph (residual vs fitted, normal q-q, Scale-location and residua ...
Can you explain the result of each graph (residual vs fitted, normal q-q, Scale-location and residuals vs leverage)
Also, which test should I do according to the graphs?
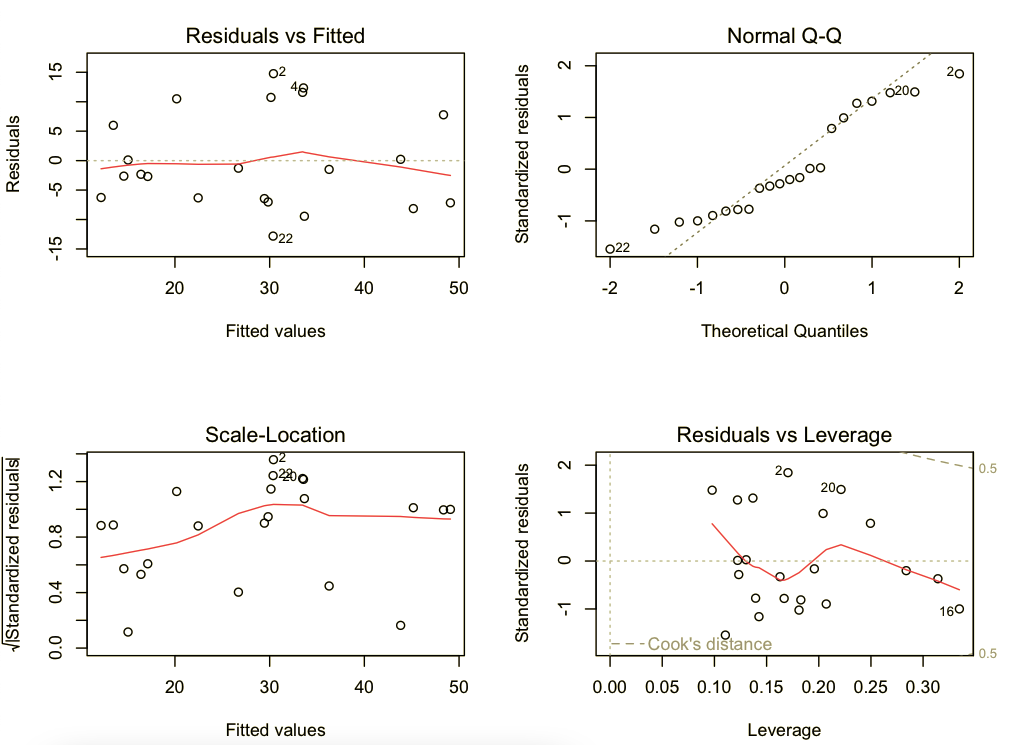
Fitted values Theoretical Quantiles Residuals vs Leverage Fitted values Leverage
Expert Answer
Given that a) first graph : Residual vr fitter graph . Here are the characteristics of a well-behaved residual vs. fits plot and what they suggest abo