Home
Expert Answers
Place Order
How It Works
About Us
Contact Us
Sign In / Sign Up
Sign In
Sign Up
Home
/
Expert Answers
/
Computer Science
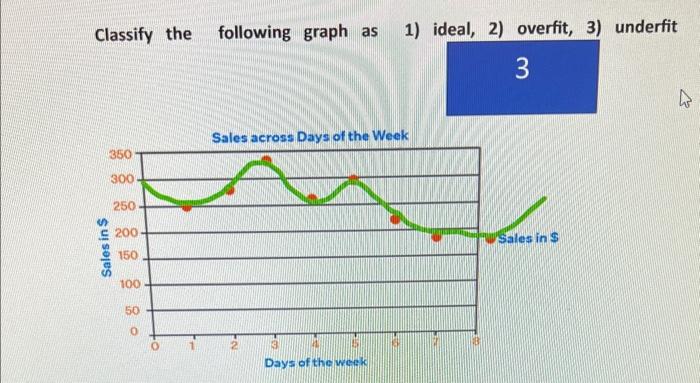
/ classify-the-following-graph-as-1-ideal-2-overfit-3-underfit-pa650
(Solved): Classify the following graph as 1) ideal, 2) overfit, 3) underfit ...
Classify the following graph as 1) ideal, 2) overfit, 3) underfit
We have an Answer from Expert
View Expert Answer
Expert Answer
From the graph, it appears that the sales performance starts off low when the complexity of the model is low (e.g., a straight line), increases as the
We have an Answer from Expert
Buy This Answer $5
Place Order
We Provide Services Across The Globe
Order Now
Go To Answered Questions