Home /
Expert Answers /
Algebra /
complete-the-t-chart-below-for-the-given-equation-y-x-2-x-y-2-0-correct-1-0-1-2-0-corre-pa889
(Solved): Complete the t-chart below for the given equation. y = | x | 2 x y -2 0 Correct -1 0 1 2 0 Corre ...
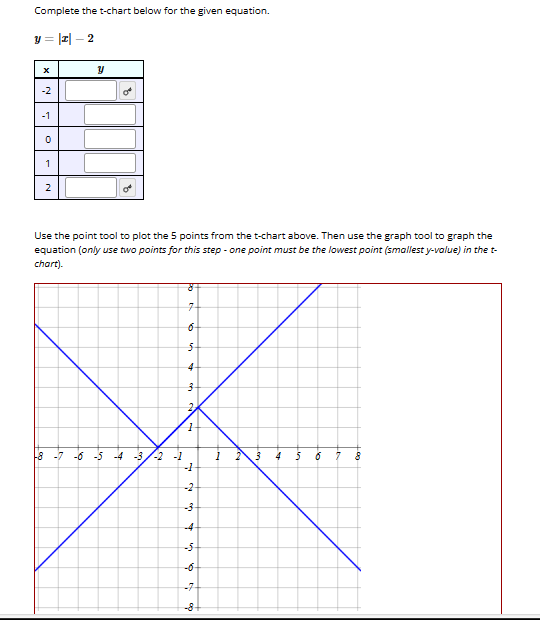
Complete the t-chart below for the given equation. Use the point tool to plot the 5 points from the t-chart above. Then use the graph tool to graph the equation (only use two points for this step - one point must be the lowest point (smallest -volue) in the tchart).