Home /
Expert Answers /
Statistics and Probability /
consider-the-density-curve-plotited-below-find-p-x17-find-p-x-gt-22-use-the-graph-of-pa997
(Solved): Consider the density curve plotited below: Find P(X17) : Find P(X>22) : Use the graph of ...
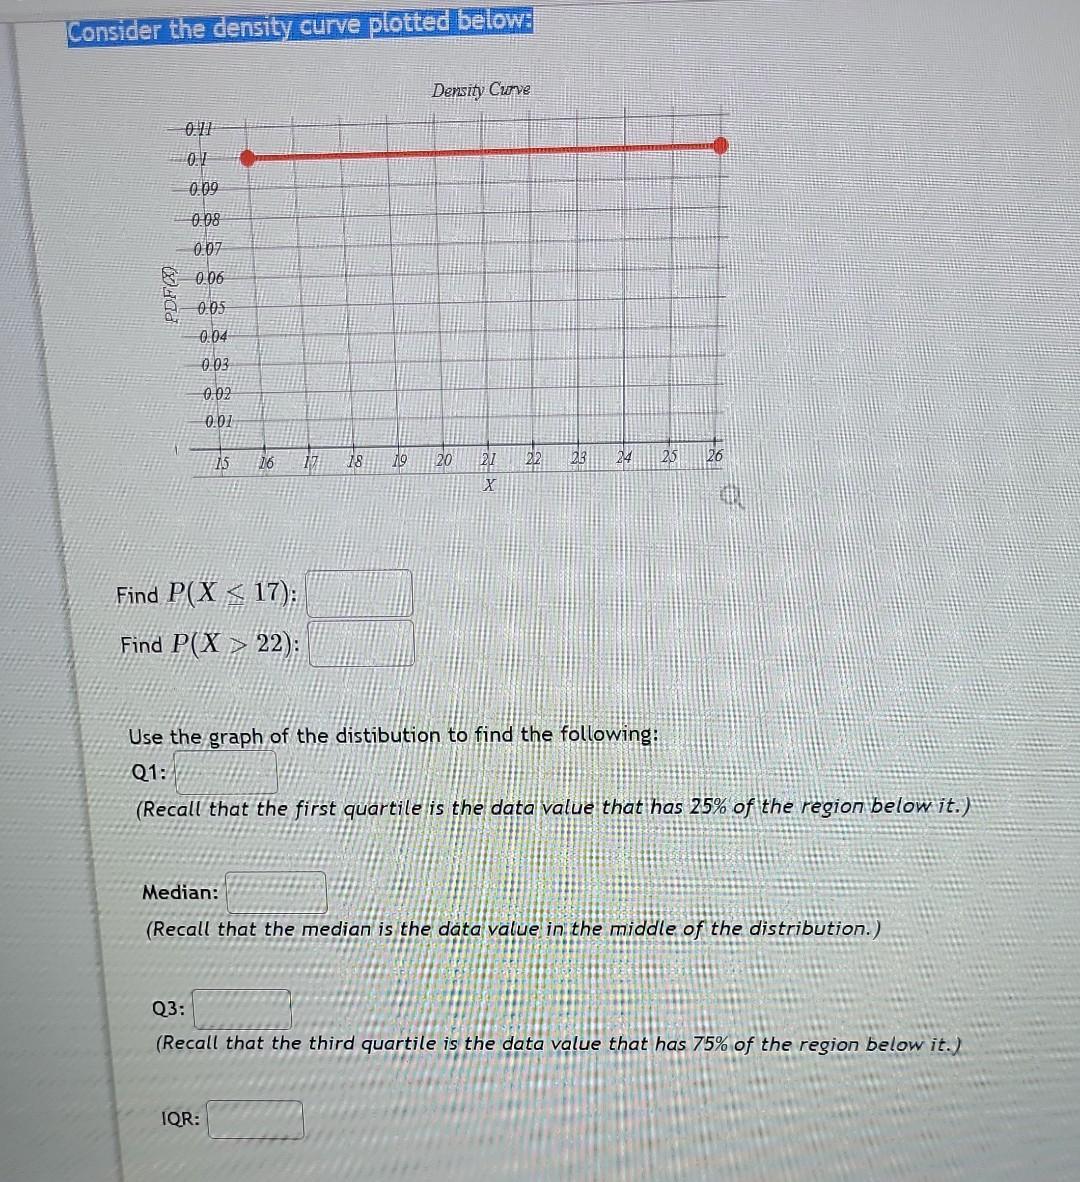
Consider the density curve plotited below: Find : Find : Use the graph of the distibution to find the following: Q1: (Recall that the first quartile is the data value that has of the region below it.) Median: (Recall that the median is the data value in the middle of the distribution.) Q3: (Recall that the third quartile is the data value that has of the region below it.) IQR: