Home /
Expert Answers /
Statistics and Probability /
consider-the-following-contingency-table-of-observed-frequencies-complete-parts-a-through-d-beto-pa515
(Solved): Consider the following contingency table of observed frequencies. Complete parts a, through d beto ...
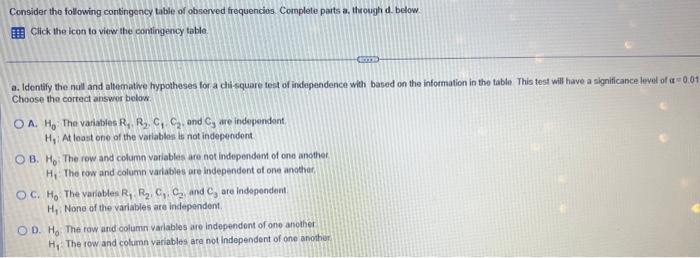
Consider the following contingency table of observed frequencies. Complete parts a, through d betow. Click the icon to view the contingency table. a. Identify the null and altematwe hypotheses for a chisquare test of independence with based on the intormation in the table This test will have a significance level of a w \( 0.01 \) Choose the correct answor below. A. \( H_{0} \). The variabies \( R_{1}, R_{2}, C_{1}, C_{2} \), and \( C_{3} \) are independont. \( \mathrm{H}_{1} \). At least one of the variablos is not independent. B. \( \mathrm{H}_{0} \). The row and column variables are not independem of one another \( H_{1} \). The row and column varables are independent of one another, C. \( H_{0} \). The variables \( R_{1}, R_{2}, C_{1}, C_{2} \), and \( C_{3} \) are independent. \( \mathrm{H}_{1} \). None of the variables ate independent. D. \( \mathrm{H}_{0} \). The fow and columin varlables are independent of one anothet \( H_{1} \). The tow and column variables are not independent of one anothir:
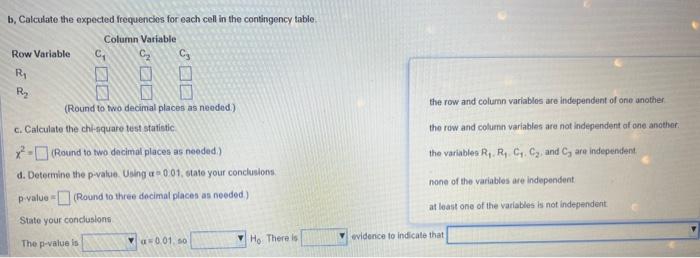
b. Calculate the expected frequencios for each cell in the contingency table. jded) the row and column variables are independent of one another. c. Calculate the chi-nquare test statistic: the row and column variables are not independent of one another. \( x^{2}= \) (Round to two decimal places as needed.) the variablea \( R_{1}, R_{1}, C_{1}, C_{2} \), and \( C_{3} \) are independent d. Determine the p-value. Using o \( =0.01 \), state your conclusions. P.yalue = (Round to three decimal places as needed) none of the variables are independent. Siate your concluslons The p-value is \( \boldsymbol{u}=0.01,50 \) \( H_{0} \) : There is at least one of the variables is not independent.
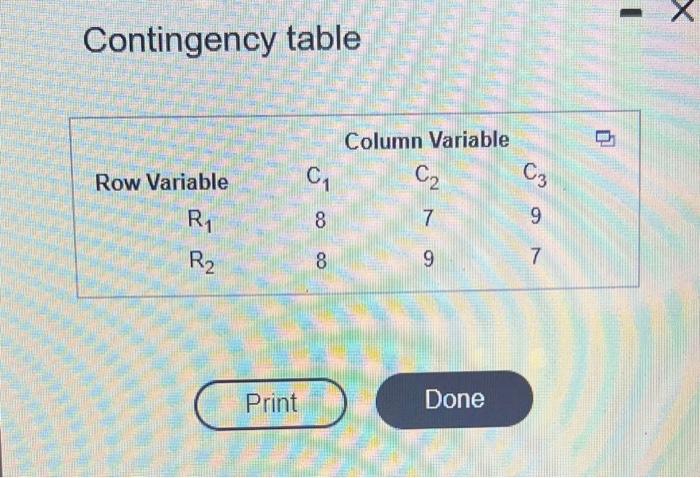
Contingency table
Expert Answer
using excel>add in>phstat>multiple sample test>chi square we have Chi-Square Test Observed Frequencies Column variable Calculations Row variable C1 C2