(Solved): Consider the following table of data. \begin{tabular}{lcllll} Defects per & 100 & Vehicles ( ...
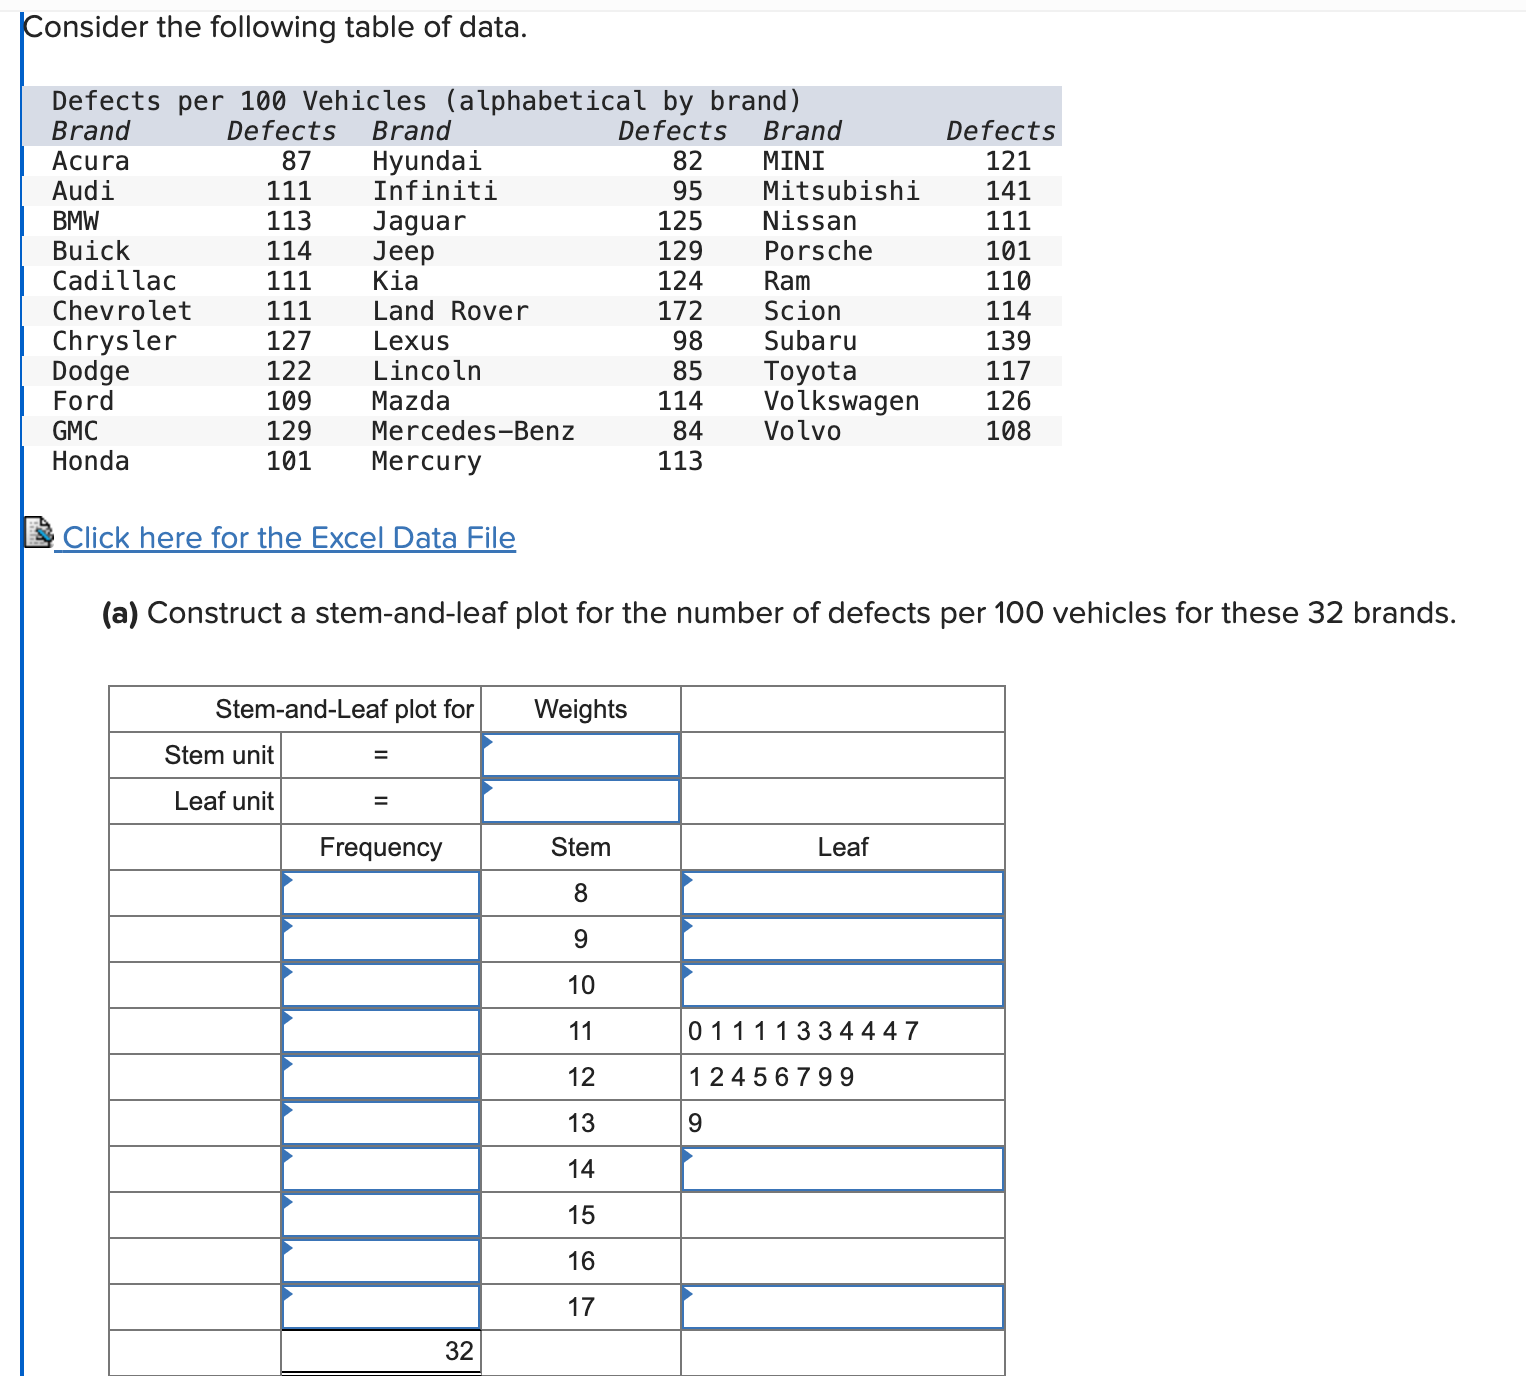
Consider the following table of data. \begin{tabular}{lcllll} Defects per & 100 & Vehicles (alphabetical by brand) & \\ Brand & Defects & Brand & Defects & Brand & Defects \\ Acura & 87 & Hyundai & 82 & MINI & 121 \\ Audi & 111 & Infiniti & 95 & Mitsubishi & 141 \\ BMW & 113 & Jaguar & 125 & Nissan & 111 \\ Buick & 114 & Jeep & 129 & Porsche & 101 \\ Cadillac & 111 & Kia & 124 & Ram & 110 \\ Chevrolet & 111 & Land Rover & 172 & Scion & 114 \\ Chrysler & 127 & Lexus & 98 & Subaru & 139 \\ Dodge & 122 & Lincoln & 85 & Toyota & 117 \\ Ford & 109 & Mazda & 114 & Volkswagen & 126 \\ GMC & 129 & Mercedes-Benz & 84 & Volvo & 108 \\ Honda & 101 & Mercury & 113 & & \end{tabular} Click here for the Excel Data File (a) Construct a stem-and-leaf plot for the number of defects per 100 vehicles for these 32 brands. \begin{tabular}{|c|c|c|c|} \hline \multicolumn{2}{|l|}{Stem-and-Leaf plot for} & Weights & \\ \hline Stem unit & \( = \) & & \\ \hline Leaf unit & \( = \) & & \\ \hline & Frequency & Stem & Leaf \\ \hline & & 8 & \\ \hline & & 9 & \\ \hline & & 10 & \\ \hline & & 11 & 01111334447 \\ \hline & & 12 & 12456799 \\ \hline & & 13 & 9 \\ \hline & & 14 & \\ \hline & & 15 & \\ \hline & & 16 & \\ \hline & & 17 & \\ \hline & 32 & & \\ \hline \end{tabular}