Home /
Expert Answers /
Statistics and Probability /
consider-the-following-time-series-data-a-choose-the-correct-time-series-plot-what-type-of-pa-pa871
(Solved): Consider the following time series data. (a) Choose the correct time series plot. What type of pa ...
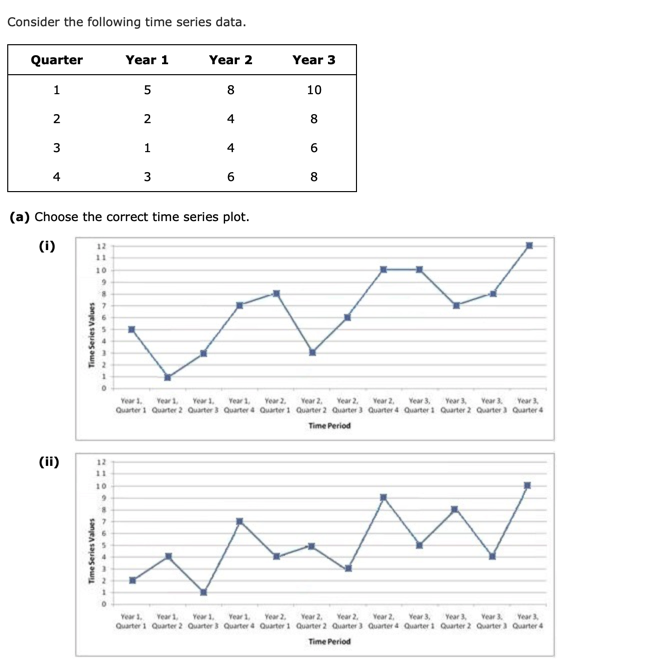
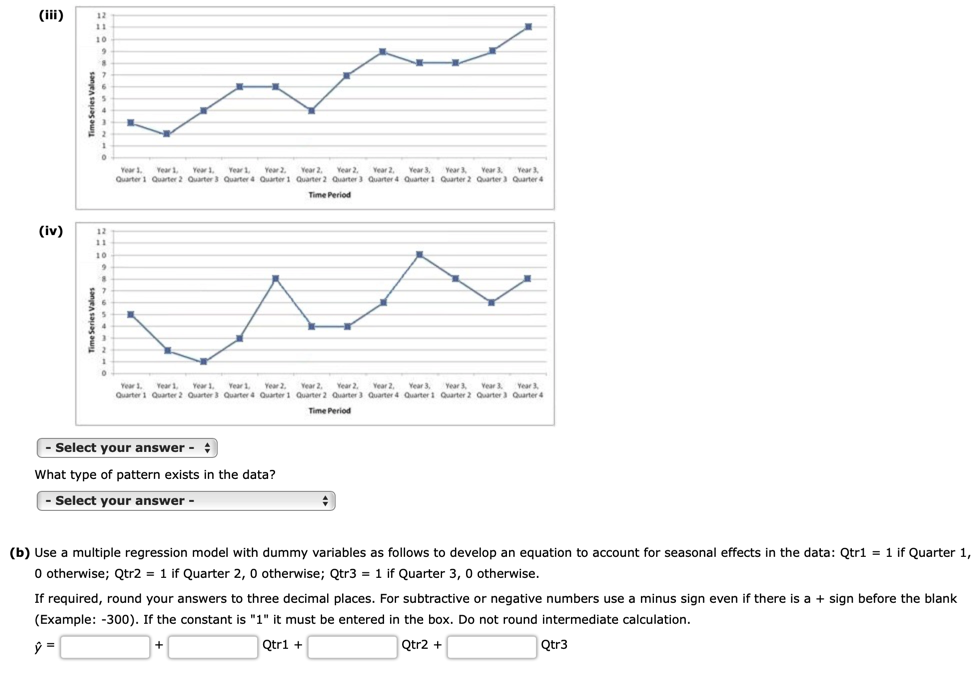
Consider the following time series data. (a) Choose the correct time series plot.
What type of pattern exists in the data? b) Use a multiple regression model with dummy variables as follows to develop an equation to account for seasonal effects in the data: 0 otherwise; \( Q \operatorname{tr} 2=1 \) if Quarter 2, 0 otherwise; Qtr3 = 1 if Quarter 3, 0 otherwise. (Example: \( -300 \) ). If the constant is " 1 " it must be entered in the box. Do not round intermediate calculation. \[ \hat{y}=+\quad \mathrm{Q} \operatorname{tr} 1+\quad \mathrm{Qtr} 2+\quad \mathrm{Qtr} 3 \]
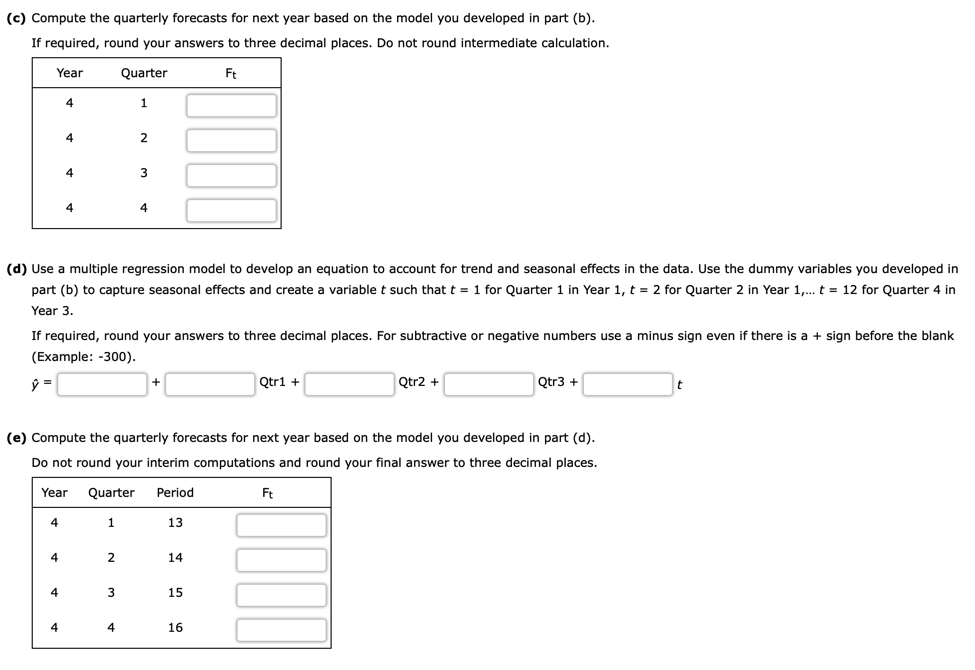
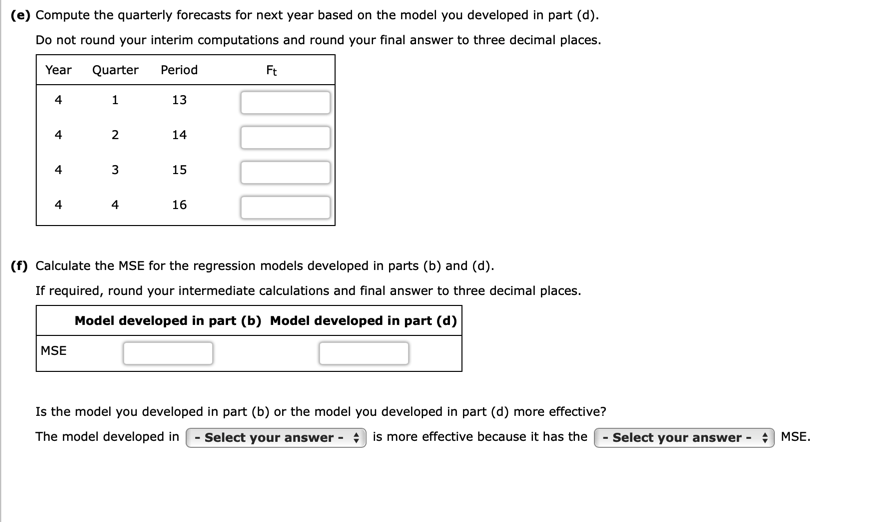
(c) Compute the quarterly forecasts for next year based on the model you developed in part (b). If required, round your answers to three decimal places. Do not round intermediate calculation. part (b) to capture seasonal effects and create a variable \( t \) such that \( t=1 \) for Quarter 1 in Year \( 1, t=2 \) for Quarter 2 in Year \( 1, \ldots t=12 \) for Quarter 4 in Year 3. If required, round your answers to three decimal places. For subtractive or negative numbers use a minus sign even if there is a sign before the blank (Example: -300). \[ \hat{y}=+\operatorname{Qtr1}+\quad \mathrm{Qtr} 2+\quad \operatorname{Qtr3}+\quad t \] (e) Compute the quarterly forecasts for next year based on the model you developed in part (d). Do not round your interim computations and round your final answer to three decimal places.
(e) Compute the quarterly forecasts for next year based on the model you developed in part (d). Do not round your interim computations and round your final answer to three decimal places. (f) Calculate the MSE for the regression models developed in parts (b) and (d). If required, round your intermediate calculations and final answer to three decimal places. Is the model you developed in part (b) or the model you developed in part (d) more effective? The model developed in is more effective because it has the MSE.