(Solved): Consider trade in automobiles between the United States and Europe. The average European car costs ...
Consider trade in automobiles between the United States and Europe. The average European car costs
€17,500. Suppose that the United States does not import any other goods and services from other countries. In March, the U.S. dollar-euro exchange rate is
$1.18per euro, and the United States imports 110,000 European cars at this exchange rate. Therefore, in March, the United States spends a total of. on imported European cars. If the total value of U.S. exports is
$1.37billion, the United States has net exports of In May, the U.S. dollar-euro exchange rate rises to
$1.47per euro. U.S. consumers respond to the dollar depreciation by reducing their imports to 100,000 European cars. Assuming that the average cost of a European car remains
€17,500, the United States spends a total of I on imported European cars in May. If the total value of U.S. exports remains
$1.37billion, the United States has net exports of Suppose the U.S. dollar-euro exchange rate remains at
$1.47per euro for the rest of the year, and the average cost of a European car remains
€17,500. In October, the United States reduces its imports to 90,000 European cars. As a result, the United States spends a total of _ on imported European cars. In October, the dollar depreciation that occurred in May finally affects foreign demand: U.S. goods become relatively less expensive for foreigners, causing the demand for U.S. goods to increase. As a result, the total value of U.S. exports rises to
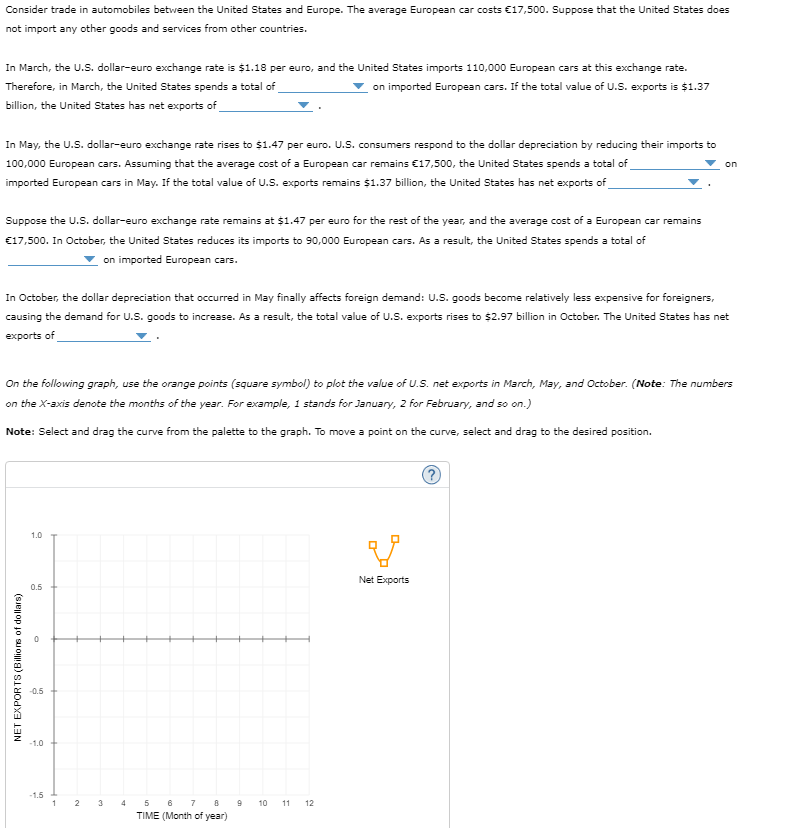
$2.97billion in October. The United States has net exports of On the following graph, use the orange points (square symbol) to plot the value of U.S. net exports in March, May, and October. (Note: The numbers on the
x-axis denote the months of the year. For example, 1 stands for January, 2 for February, and so on.) Note: Select and drag the curve from the palette to the graph. To move a point on the curve, select and drag to the desired position.