Home /
Expert Answers /
Statistics and Probability /
construct-a-frequency-distribution-and-a-frequency-histogram-for-the-data-set-using-the-indicated-nu-pa381
(Solved): Construct a frequency distribution and a frequency histogram for the data set using the indicated nu ...
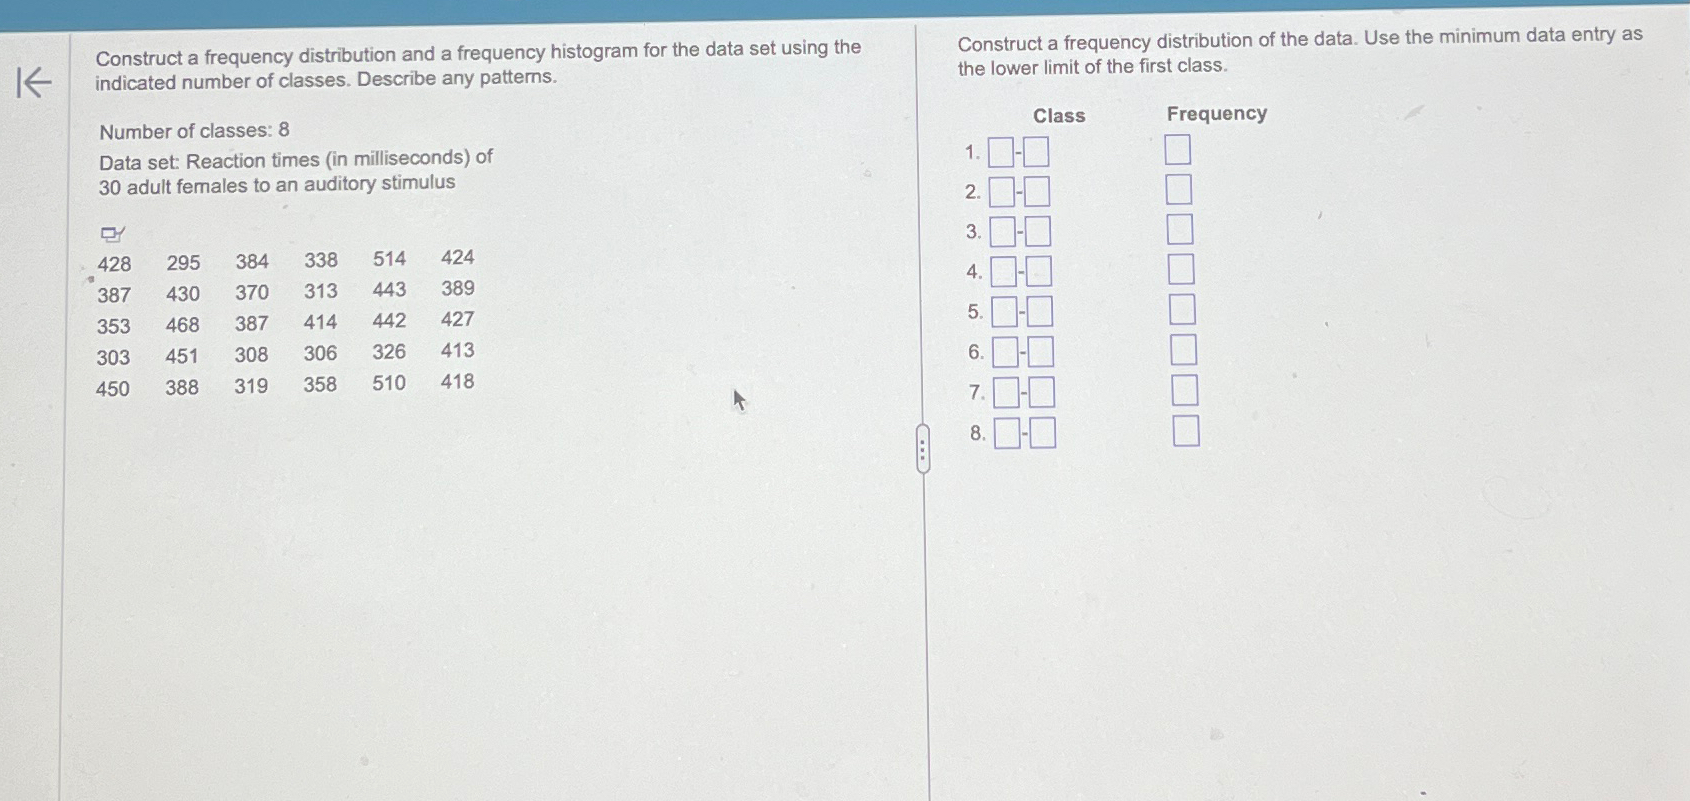
Construct a frequency distribution and a frequency histogram for the data set using the indicated number of classes. Describe any patterns. Number of classes: 8 Data set: Reaction times (in milliseconds) of 30 adult females to an auditory stimulus \table[[428,295,384,338,514,424],[387,430,370,313,443,389],[353,468,387,414,442,427],[303,451,308,306,326,413],[450,388,319,358,510,418]] Construct a frequency distribution of the data. Use the minimum data entry as the lower limit of the first class. Class Frequency
?
?
?
?
?
?
?8 .
?