Home /
Expert Answers /
Chemistry /
could-you-interprate-these-peaks-peak-list-chart-seen-on-this-gcms-graph-in-detail-and-what-their-pa511
(Solved): could you interprate these peaks (peak list chart) seen on this GCMS graph in detail and what their ...
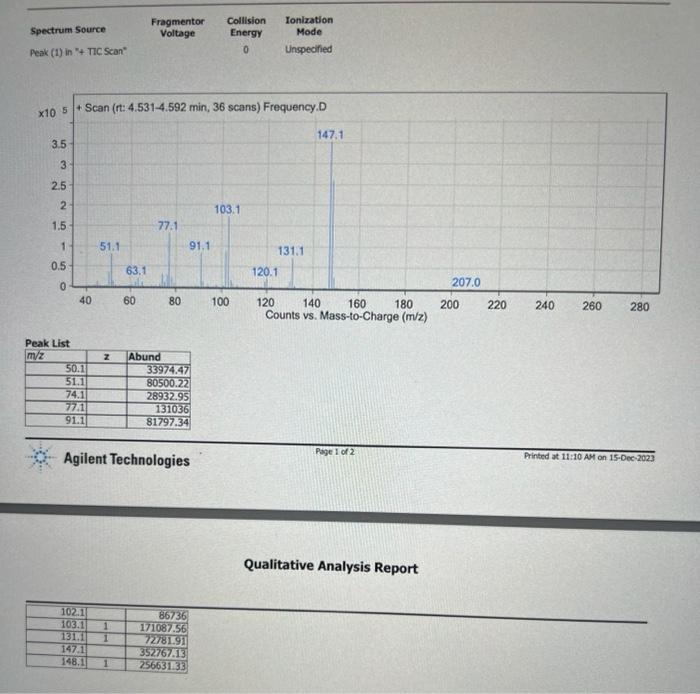
could you interprate these peaks (peak list chart) seen on this GCMS graph in detail and what their cause is from a synthesizing cinnamic acid through perkin reaction
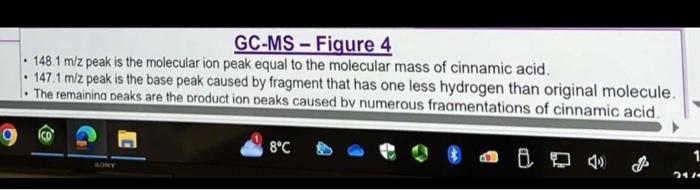
example of explanation for the peak im looking for:
the graph:
GC-MS - Figure 4 - peak is the molecular ion peak equal to the molecular mass of cinnamic acid. - peak is the base peak caused by fragment that has one less hydrogen than original molecule. - The remainina neaks are the broduct ion Deaks caused bv numerous fraamentations of cinnamic acid.
Agilent Technologies Qualitative Analysis Report
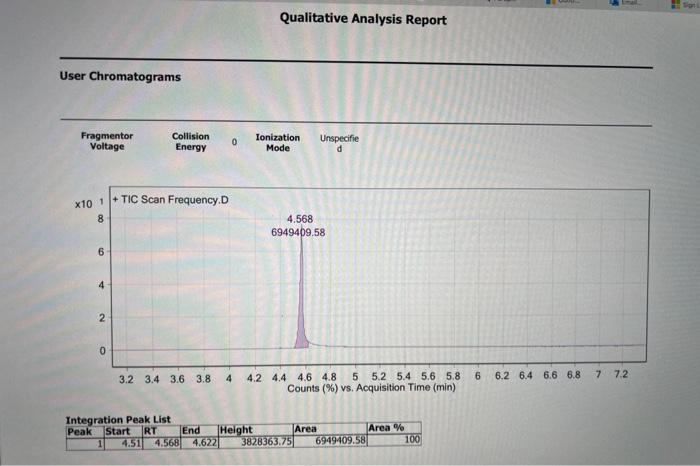
Qualitative Analysis Report User Chromatograms
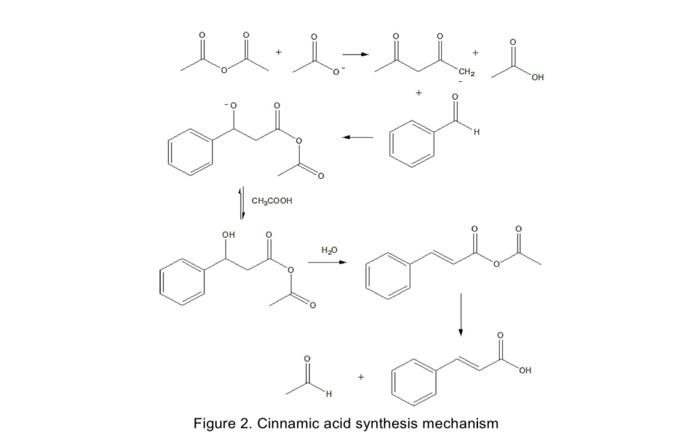
( Figure 2. Cinnamic acid synthesis mechanism